Kubernetes Autoscaling Beyond HPA - Event-Driven KEDA and VPA Resource Optimization
// Master advanced Kubernetes scaling strategies with KEDA for event-driven autoscaling and VPA for resource optimization. Real production examples, cost savings, and complete implementation guide for SRE teams.
I have spent years fighting the same “battle”: pods running out of memory at 3 AM, or paying for idle resources sitting at 10% utilization. HPA works great when your traffic follows a predictable curve, but what happens when you are processing background jobs, running analytics during business hours, or dealing with sudden database load spikes?
The built-in Horizontal Pod Autoscaler does one thing well. It scales pods based on CPU and memory. That’s fine for basic web apps, but completely useless when you need to scale based on queue depth, database connections, or time based patterns. I have watched teams write custom controllers and hacky scripts just to solve these problems.
KEDA and VPA changed that. KEDA brings event-driven autoscaling to Kubernetes. Finally, you can scale based on what actually matters to your application. VPA tackles the other half of the problem, automatically right-sizing your resource requests so you are not guessing anymore.
Who This Guide Is For#
This guide is written for:
- SRE teams managing production Kubernetes clusters looking to optimize costs and reliability
- Platform engineers building internal developer platforms with advanced autoscaling
- DevOps practitioners already familiar with basic HPA who need event-driven scaling
- Teams running batch jobs, database-heavy applications, or time-sensitive workloads
Prerequisites: Basic understanding of Kubernetes, HPA, and Deployments. If you are new to Kubernetes autoscaling, start with the official HPA documentation first.
Try It Yourself#
All examples in this post are available in a working demo repository with load testing and infrastructure templates:
What’s included:
- PostgreSQL, Prometheus, Cron, and HTTP metric scalers
- VPA configurations for all update modes
- HPA + KEDA + VPA integration examples
- Terraform templates for AKS (Azure Kubernetes Service)
- Load testing scripts to validate scaling behavior
Summary#
- HPA scales horizontally based on CPU/memory, but lacks event-driven capabilities
- KEDA enables scaling based on external events (queues, streams, databases)
- VPA optimizes resource requests/limits vertically without horizontal scaling
- Combining HPA, KEDA, and VPA creates a comprehensive autoscaling strategy
- Try the demo: Kubernetes Autoscaling Demo
Understanding the Autoscaling Landscape#
Before diving into KEDA and VPA, let’s clarify the different scaling dimensions:
| Scaling Type | What It Does | Use Case | Tool |
|---|---|---|---|
| Horizontal | Add/remove pod replicas | Traffic spikes, load balancing | HPA, KEDA |
| Vertical | Adjust CPU/memory requests | Right-sizing resources | VPA |
| Cluster | Add/remove nodes | Node capacity exhaustion | Karpenter, CA |
Why HPA Isn’t Enough#
Don’t get me wrong. HPA is solid for what it does. But here’s where it breaks down.
You can’t scale based on queue depth without jumping through hoops with custom metrics adapters. Your batch jobs either run with way too many resources or not enough. Time-based scaling? Forget about it. You will need CronJobs and external scripts. And good luck optimizing those resource requests; everyone just picks numbers and hopes for the best.
I have seen teams set CPU requests at 100m “just in case” when pods actually need 50m, wasting half their cluster capacity. Or they set memory too low and watch OOMKills rain down during peak hours.
That’s the gap KEDA and VPA fill.
KEDA: Event-Driven Autoscaling#
KEDA (Kubernetes Event-Driven Autoscaling) is a CNCF graduated project, which means it’s battle-tested and backed by the community. The core idea is simple: scale based on what actually drives your workload, not just CPU percentages.
Need to scale workers based on how many rows are sitting in your database? Done. Want to spin up pods only during business hours? Easy. Have a spike in Prometheus metrics that indicates real user load? KEDA’s got you.
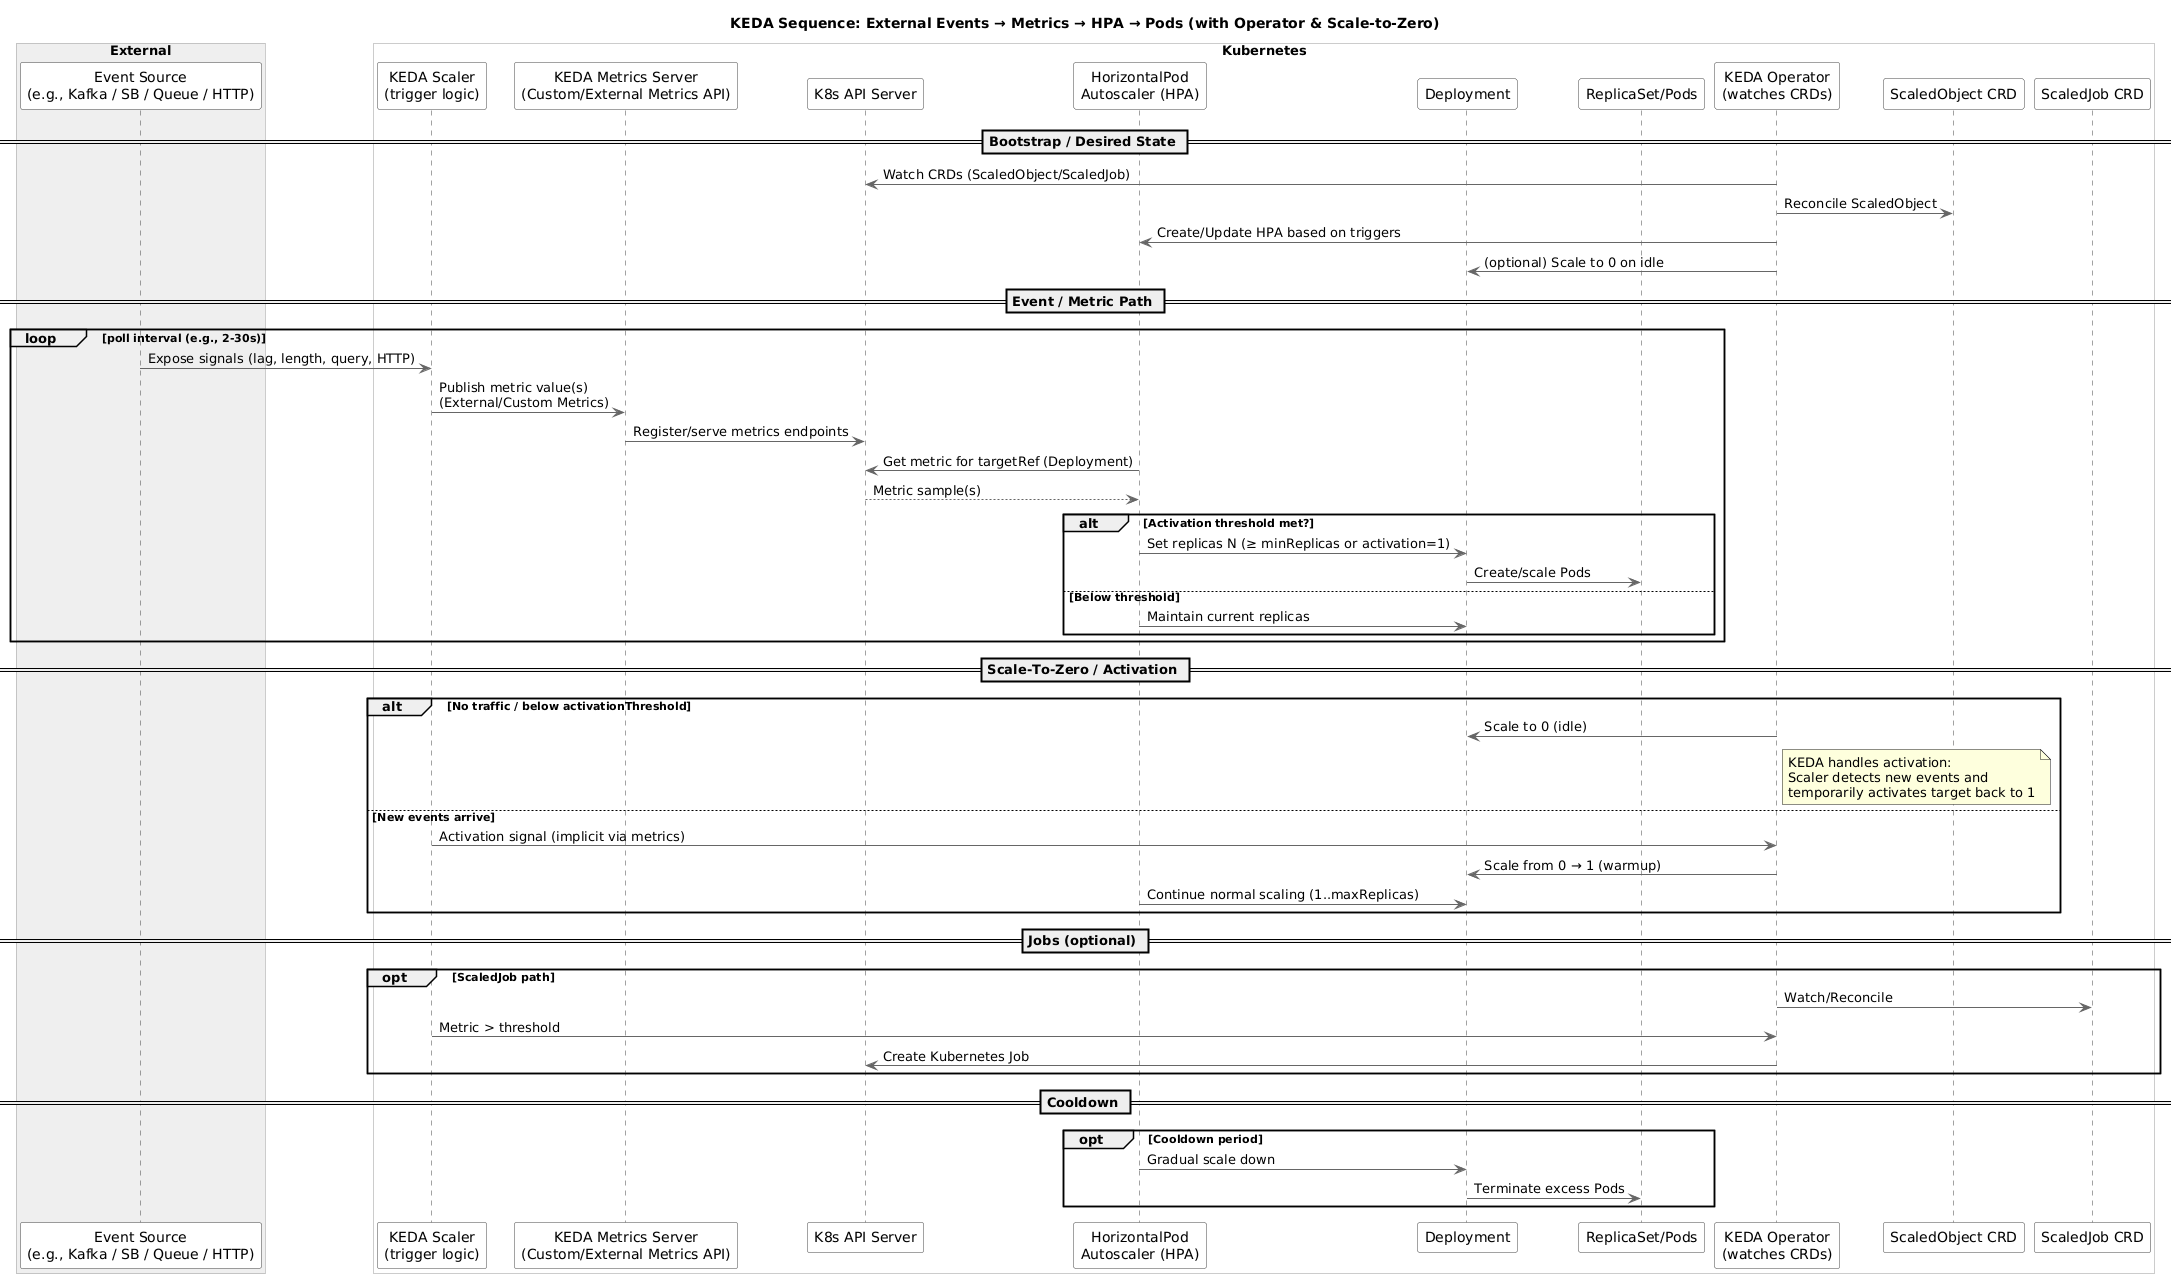
How KEDA Works#
KEDA operates through three core components:
- Scaler: Connects to external event sources (60+ built-in scalers)
- Metrics Adapter: Exposes event metrics to HPA
- Controller: Manages ScaledObject and ScaledJob custom resources
External Event Source (e.g., PostgreSQL)
            ↓
      KEDA Scaler (monitors query results)
            ↓
      Metrics Adapter (exposes metrics)
            ↓
      HPA (scales deployment)
            ↓
      Pods (scaled up/down)
KEDA Architecture Deep Dive#
KEDA enhances Kubernetes without replacing existing components:
| Component | Role | Description |
|---|---|---|
| Operator | Lifecycle Management | Watches ScaledObject/ScaledJob CRDs |
| Metrics Server | Metric Provider | Implements HPA External Metrics API |
| Admission Webhooks | Validation | Ensures valid ScaledObject configurations |
| Scalers | Event Monitoring | Connects to external sources (AWS SQS, Kafka, etc.) |
Note: KEDA doesn’t replace HPA extends it by acting as a metrics adapter. When you create a ScaledObject, KEDA dynamically generates an HPA resource behind the scenes and feeds it custom metrics from external event sources. This means KEDA-managed workloads still use the standard HPA controller, but with event-driven metrics instead of just CPU/memory.
KEDA in Action: Real-World Use Cases#
Use Case 1: Database Query Load#
Scale API replicas based on pending orders in PostgreSQL:
apiVersion: keda.sh/v1alpha1
kind: ScaledObject
metadata:
  name: postgres-scaler
  namespace: demo
spec:
  scaleTargetRef:
    name: api-gateway-postgres
  minReplicaCount: 3
  maxReplicaCount: 50
  cooldownPeriod: 300  # 5 minutes cooldown before scaling to min
  pollingInterval: 30  # Check every 30 seconds
  fallback:
    failureThreshold: 3
    replicas: 10  # Safe fallback replica count
  triggers:
    - type: postgresql
      metadata:
        host: "postgresql.demo.svc.cluster.local"
        port: "5432"
        userName: "postgres"
        dbName: "demo"
        sslmode: "disable"
        # Query returns number of pending orders divided by 100
        # Each replica can process ~100 orders
        query: "SELECT CEIL(COUNT(*)/100.0) FROM orders WHERE status = 'pending'"
        targetQueryValue: "5"  # Scale up when result > 5 (more than 500 pending orders)
        activationQueryValue: "1"  # Activate scaling when there's at least 1 pending order batch
      authenticationRef:
        name: postgres-trigger-auth # Reference to secret, never hardcode credentials!
Security Note: Never hardcode database credentials or API tokens in YAML manifests. Always use
TriggerAuthenticationresources that reference Kubernetes secrets. See the “Installation and Setup” section for examples.
This is incredibly useful when your application processes pending database records. Instead of waiting for CPU to spike (which might be too late), you’re scaling proactively based on actual workload. In this demo, each replica can handle approximately 100 pending orders, so KEDA scales appropriately as the queue grows.
Use Case 2: Cron-Based Batch Processing#
Scale workloads based on scheduled time windows:
apiVersion: keda.sh/v1alpha1
kind: ScaledObject
metadata:
  name: cron-scaler-utc
  namespace: demo
spec:
  scaleTargetRef:
    name: report-generator
  minReplicaCount: 0  # Scale to zero outside business hours
  maxReplicaCount: 15
  triggers:
    - type: cron
      metadata:
        timezone: UTC
        start: "0 6 * * 1-5"  # 6 AM UTC on weekdays
        end: "0 20 * * 1-5"   # 8 PM UTC on weekdays
        desiredReplicas: "15"
Real cost savings story: We implemented this for a financial reporting system that only runs during business hours. Before KEDA, we kept 15 replicas running 24/7 because the manual process of scaling up/down was too error-prone.
Before KEDA:
- 15 replicas × 24 hours × 30 days = 10,800 replica-hours/month
- Average cost per replica-hour: €0.04 (Standard_D2s_v3 spot instances on AKS)
- Monthly cost: €432
After KEDA with cron scaling:
- Business hours (10 hours/day): 15 replicas × 10 hours × 22 workdays = 3,300 replica-hours
- Off-hours and weekends: 0 replicas
- Monthly cost: €132
Result: 69% cost reduction (€300/month savings) on this single workload. The implementation took 2 hours, including testing. ROI was immediate.
Beyond cost, we also eliminated the manual toil of scaling the deployment up/down, which previously required coordination between teams and occasionally caused incidents when someone forgot to scale it back down.
Use Case 3: HTTP Traffic Metrics#
Scale based on custom application metrics from Prometheus:
apiVersion: keda.sh/v1alpha1
kind: ScaledObject
metadata:
  name: http-advanced-scaler
  namespace: demo
spec:
  scaleTargetRef:
    name: web-app
  minReplicaCount: 5
  maxReplicaCount: 100
  cooldownPeriod: 300
  pollingInterval: 15
  triggers:
    # Scale based on HTTP request rate (successful requests only)
    - type: prometheus
      metadata:
        serverAddress: http://prometheus-kube-prometheus-prometheus.monitoring.svc.cluster.local:9090
        metricName: http_success_rate
        threshold: "500"
        query: |
          sum(rate(http_request_duration_seconds_count{service="web-app",status=~"2.."}[2m]))
Scaling on request rate is way more accurate than CPU for stateless services. You catch traffic spikes before they turn into performance issues, and you’re not scaling based on some arbitrary CPU threshold that might mean different things on different node types. This demo uses HTTP request duration histograms which are more accurate than simple request counters.
Use Case 4: External HTTP Endpoint Monitoring#
Scale based on external API metrics:
apiVersion: keda.sh/v1alpha1
kind: ScaledObject
metadata:
  name: metrics-api-scaler
  namespace: demo
spec:
  scaleTargetRef:
    name: data-processor
  minReplicaCount: 2
  maxReplicaCount: 30
  cooldownPeriod: 300  # 5 minutes cooldown before scaling to min
  pollingInterval: 30  # Check metrics every 30 seconds
  fallback:
    failureThreshold: 3
    replicas: 5  # Safe fallback if API is unreachable
  triggers:
    - type: metrics-api
      metadata:
        targetValue: "100"
        url: "http://mock-metrics-api.demo.svc.cluster.local:8080"
        valueLocation: "jobs.pending"
        method: "GET"
This lets you query external monitoring systems or APIs and scale based on business metrics like pending jobs or active user sessions. Perfect for integrating with custom telemetry platforms or bridging legacy systems with Kubernetes autoscaling. The demo includes a mock metrics API that simulates a real external endpoint.
KEDA Advanced Patterns for SREs#
Pattern 1: Scale to Zero#
KEDA’s killer feature is scaling deployments to zero during idle periods:
apiVersion: keda.sh/v1alpha1
kind: ScaledObject
metadata:
  name: ml-inference-scaler
  namespace: demo
spec:
  scaleTargetRef:
    name: ml-inference
  minReplicaCount: 1  # Start with 1 to generate initial metrics
  maxReplicaCount: 10
  cooldownPeriod: 120  # Wait 2 minutes of inactivity before scaling to min
  pollingInterval: 30
  triggers:
    - type: prometheus
      metadata:
        serverAddress: http://prometheus-kube-prometheus-prometheus.monitoring.svc.cluster.local:9090
        metricName: prediction_requests
        # Scale up if there's at least 1 request in the last 2 minutes
        threshold: "1"
        # Scale down to 0 if no requests
        activationThreshold: "0.1"
        query: |
          sum(rate(http_request_duration_seconds_count{service="ml-inference"}[2m])) or vector(0)
Benefits:
- Reduce costs during off-hours
- Perfect for batch/cron workloads
- Eliminates idle resource consumption
Pattern 2: Multiple Triggers (Composite Scaling)#
Combine multiple event sources for intelligent scaling:
apiVersion: keda.sh/v1alpha1
kind: ScaledObject
metadata:
  name: multi-trigger-scaler
  namespace: demo
spec:
  scaleTargetRef:
    name: order-processor
  minReplicaCount: 2
  maxReplicaCount: 50
  cooldownPeriod: 300  # 5 minutes
  pollingInterval: 30  # Check every 30 seconds
  fallback:
    failureThreshold: 3
    replicas: 10  # Safe replica count during failures
  triggers:
    - type: postgresql
      metadata:
        host: "postgresql.demo.svc.cluster.local"
        port: "5432"
        userName: "postgres"
        dbName: "demo"
        sslmode: "disable"
        query: "SELECT COALESCE(COUNT(*), 0) FROM orders WHERE status = 'pending'"
        targetQueryValue: "100"
        activationQueryValue: "10"
      authenticationRef:
        name: postgres-trigger-auth-multi
    - type: prometheus
      metadata:
        serverAddress: http://prometheus-kube-prometheus-prometheus.monitoring.svc.cluster.local:9090
        query: sum(rate(http_request_duration_seconds_count{service="order-processor"}[2m]))
        threshold: "500"
        activationThreshold: "50"
    - type: cpu
      metadata:
        type: Utilization
        value: "70"
Pattern 3: Fallback Configuration for Scaler Failures#
Protect against external service failures with KEDA fallback:
apiVersion: keda.sh/v1alpha1
kind: ScaledObject
metadata:
  name: resilient-scaler
spec:
  scaleTargetRef:
    name: api-service
  minReplicaCount: 3
  maxReplicaCount: 50
  fallback:
    failureThreshold: 3 # Number of consecutive failures before fallback
    replicas: 10 # Safe replica count during scaler failure
  triggers:
    - type: prometheus
      metadata:
        serverAddress: http://prometheus.monitoring.svc.cluster.local:9090
        query: sum(rate(http_requests_total[1m]))
        threshold: "100"
Why fallback matters: If your Prometheus server goes down or your database scaler can’t connect, KEDA will scale to the fallback replica count instead of leaving you stuck at minReplicaCount. This prevents incidents caused by monitoring failures.
Best practices:
- Set
failureThresholdto 3-5 to avoid false positives from transient failures - Choose fallback replicas based on historical average load (typically 50-70% of maxReplicas)
- Monitor
keda_scaler_errors_totalto detect when fallback activates
Pattern 4: ScaledJob for Batch Processing#
Use ScaledJob for one-off job scaling instead of Deployments:
apiVersion: keda.sh/v1alpha1
kind: ScaledJob
metadata:
  name: video-encoding-scaler
  namespace: demo
spec:
  jobTargetRef:
    parallelism: 1                    # Each job runs 1 pod
    completions: 1                    # Job completes after 1 success
    backoffLimit: 3                   # Retry up to 3 times on failure
    activeDeadlineSeconds: 600        # Job timeout: 10 minutes
    template:
      spec:
        restartPolicy: Never  # Required for Jobs
        containers:
          - name: encoder
            image: mysql:8.0
            resources:
              requests:
                memory: "1Gi"
                cpu: "1000m"
              limits:
                memory: "2Gi"
                cpu: "2000m"
  pollingInterval: 30                 # Check queue every 30 seconds
  successfulJobsHistoryLimit: 5       # Keep last 5 successful jobs
  failedJobsHistoryLimit: 5           # Keep last 5 failed jobs
  maxReplicaCount: 20                 # Maximum 20 parallel encoding jobs
  scalingStrategy:
    strategy: "default"               # Create jobs immediately when work exists
  triggers:
    - type: mysql
      metadata:
        host: "mysql.demo.svc.cluster.local"
        port: "3306"
        username: "root"
        dbName: "media"
        query: "SELECT COUNT(*) FROM videos WHERE status = 'pending'"
        queryValue: "1"  # Create 1 job per pending video
        activationQueryValue: "0"  # Only create jobs if there are pending videos
      authenticationRef:
        name: mysql-trigger-auth # Reference to secret, never hardcode credentials!
pollingInterval tradeoffs:
- Lower values (10-30s): Faster response to new work, more frequent queries to external systems
- Higher values (60-300s): Reduced load on external systems, slower scale-up response
- Recommendation: Start with 30s for most workloads; increase to 60-120s if external system can’t handle frequent queries
When to use ScaledJob:
- Video/image processing pipelines
- Data ETL and transformation jobs
- Machine learning training workloads
- Report generation and analytics
VPA: Vertical Pod Autoscaler#
VPA solves a different problem: the resource request guessing game. You know the drill. You deploy something, pick some numbers for CPU and memory requests, cross your fingers, and wait to see what happens.
Too high? You’re wasting cluster capacity and money. Too low? OOMKills and CPU throttling. And workloads change over time, so even if you got it right once, it might be wrong six months later.
VPA watches your actual resource usage and adjusts requests/limits automatically. No more guessing, no more manual tuning sessions. It just works.
VPA Components#
| Component | Function | Description |
|---|---|---|
| Recommender | Analysis | Monitors resource usage, provides recommendations |
| Updater | Enforcement | Evicts pods that need updated resources |
| Admission Controller | Injection | Applies VPA recommendations to new pods |
VPA Update Modes#
VPA supports multiple operational modes:
| Mode | Behavior | Use Case |
|---|---|---|
| Off | Recommendations only (no action) | Testing, observability |
| Initial | Apply only at pod creation | Stateful apps, cautious adoption |
| Recreate | Evict and recreate pods | Stateless apps, aggressive optimization |
| Auto | Automatically choose best strategy | General purpose |
VPA in Action: Resource Optimization#
Basic VPA Configuration#
apiVersion: autoscaling.k8s.io/v1
kind: VerticalPodAutoscaler
metadata:
  name: web-app-vpa
  namespace: demo
spec:
  targetRef:
    apiVersion: apps/v1
    kind: Deployment
    name: web-app
  updatePolicy:
    updateMode: "Auto"
  resourcePolicy:
    containerPolicies:
      - containerName: "*"
        minAllowed:
          cpu: 100m
          memory: 128Mi
        maxAllowed:
          cpu: 2
          memory: 4Gi
        controlledResources: ["cpu", "memory"]
VPA with Resource Boundaries#
Set guardrails to prevent extreme scaling:
apiVersion: autoscaling.k8s.io/v1
kind: VerticalPodAutoscaler
metadata:
  name: database-vpa
spec:
  targetRef:
    apiVersion: apps/v1
    kind: StatefulSet
    name: postgres
  updatePolicy:
    updateMode: "Initial" # Only on pod creation
  resourcePolicy:
    containerPolicies:
      - containerName: postgres
        minAllowed:
          cpu: 500m
          memory: 1Gi
        maxAllowed:
          cpu: 8
          memory: 16Gi
        controlledResources: ["memory"] # Only manage memory
        mode: Auto
VPA with PodDisruptionBudgets#
When using VPA in “Auto” or “Recreate” mode, combine with PodDisruptionBudgets to prevent excessive disruption:
apiVersion: policy/v1
kind: PodDisruptionBudget
metadata:
  name: app-pdb
  namespace: demo
spec:
  minAvailable: 2 # Ensure at least 2 pods remain available during VPA updates
  selector:
    matchLabels:
      app: web-app
---
apiVersion: autoscaling.k8s.io/v1
kind: VerticalPodAutoscaler
metadata:
  name: web-app-vpa
  namespace: demo
spec:
  targetRef:
    apiVersion: apps/v1
    kind: Deployment
    name: web-app
  updatePolicy:
    updateMode: "Auto"
  resourcePolicy:
    containerPolicies:
      - containerName: "*"
        minAllowed:
          cpu: 100m
          memory: 128Mi
        maxAllowed:
          cpu: 2
          memory: 4Gi
Why this matters: VPA’s “Auto” and “Recreate” modes work by evicting pods to apply new resource requests. Without a PodDisruptionBudget, VPA could evict too many pods simultaneously, causing service disruption.
Best practices:
- Set
minAvailableto at leastminReplicas - 1for your deployment - For critical services, use
minAvailable: 50%to maintain half capacity during updates - Monitor VPA eviction events:
kubectl get events --field-selector reason=EvictedByVPA - Consider using
updateMode: "Initial"for StatefulSets to avoid disruption entirely
VPA Recommendation-Only Mode#
Use VPA as an observability tool without automatic changes:
apiVersion: autoscaling.k8s.io/v1
kind: VerticalPodAutoscaler
metadata:
  name: recommendation-only-vpa
spec:
  targetRef:
    apiVersion: apps/v1
    kind: Deployment
    name: critical-app
  updatePolicy:
    updateMode: "Off" # Recommendations only
Then query recommendations:
kubectl describe vpa recommendation-only-vpa

# Output shows recommended resources:
# Container Recommendations:
#   Container Name: app
#   Lower Bound:
#     Cpu:     250m
#     Memory:  256Mi
#   Target:
#     Cpu:     500m
#     Memory:  512Mi
#   Upper Bound:
#     Cpu:     1
#     Memory:  1Gi
Combining HPA, KEDA, and VPA: The Ultimate Strategy#
The real power comes from using these tools together:
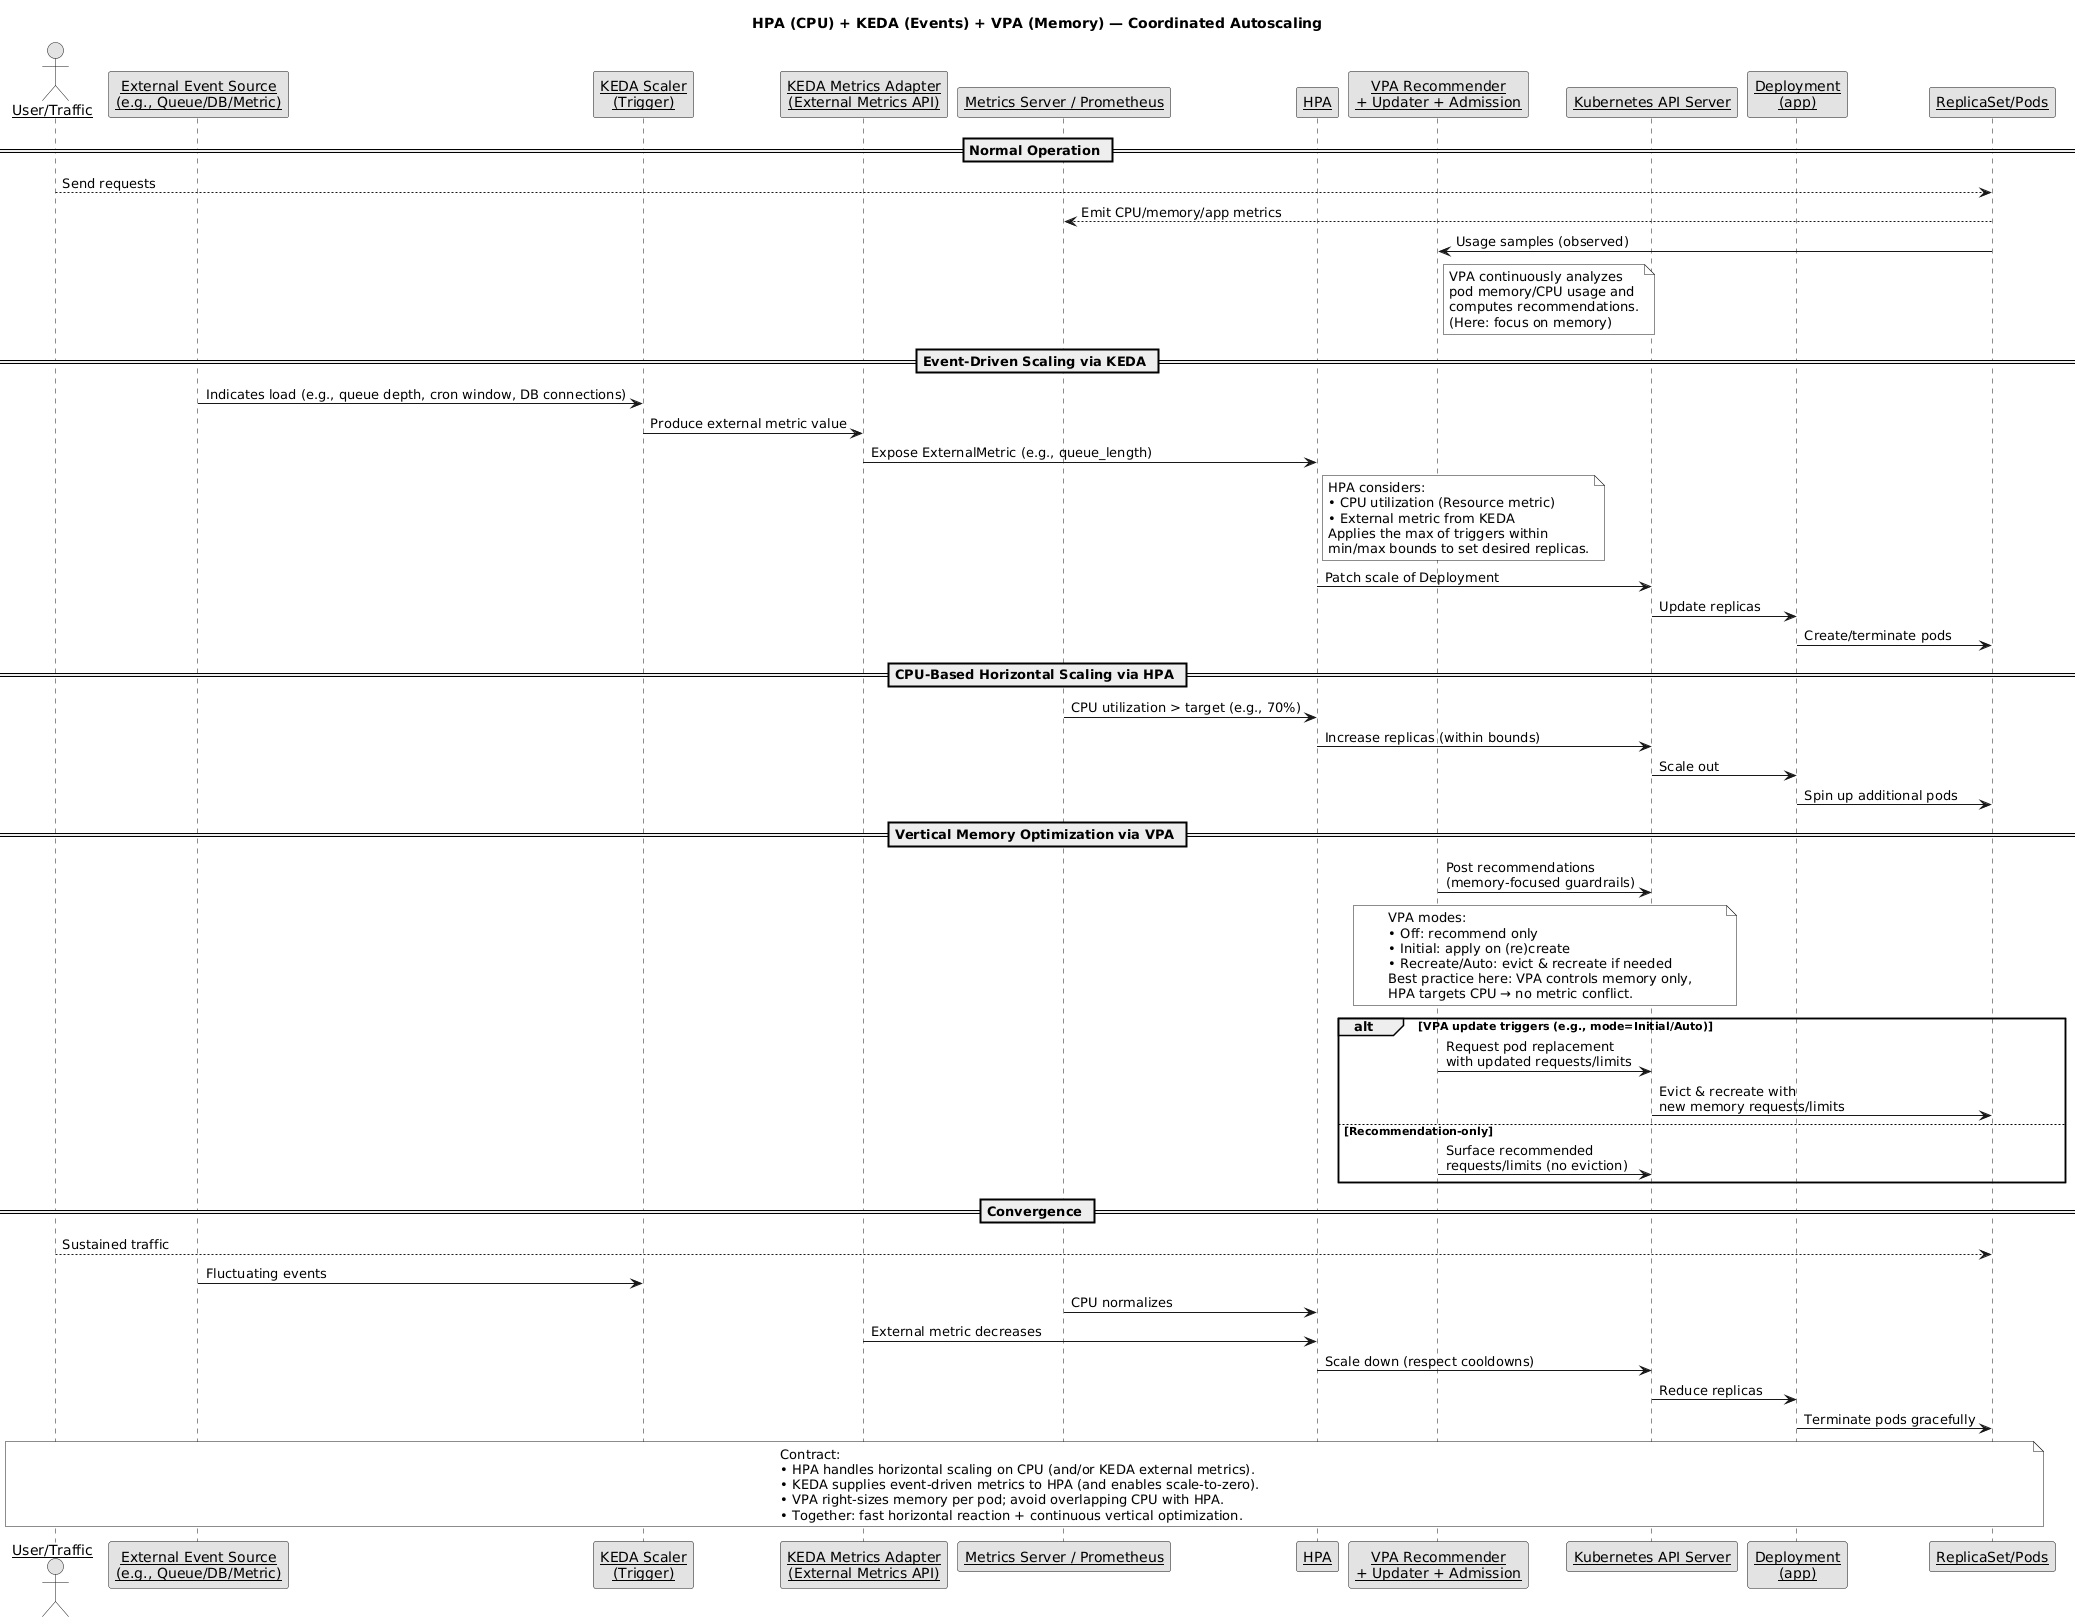
Strategy 1: HPA + VPA (Complementary Scaling)#
# HPA for horizontal scaling
apiVersion: autoscaling/v2
kind: HorizontalPodAutoscaler
metadata:
  name: app-hpa
spec:
  scaleTargetRef:
    apiVersion: apps/v1
    kind: Deployment
    name: app
  minReplicas: 3
  maxReplicas: 50
  metrics:
    - type: Resource
      resource:
        name: cpu
        target:
          type: Utilization
          averageUtilization: 70
---
# VPA for resource optimization
apiVersion: autoscaling.k8s.io/v1
kind: VerticalPodAutoscaler
metadata:
  name: app-vpa
spec:
  targetRef:
    apiVersion: apps/v1
    kind: Deployment
    name: app
  updatePolicy:
    updateMode: "Auto"
  resourcePolicy:
    containerPolicies:
      - containerName: "*"
        controlledResources: ["memory"] # VPA manages memory, HPA uses CPU
The trick here: let HPA handle horizontal scaling based on CPU, and VPA handles vertical memory optimization. Keep them on different metrics and they won’t fight each other.
Strategy 2: KEDA + VPA (Event-Driven with Optimization)#
# KEDA for event-driven scaling
apiVersion: keda.sh/v1alpha1
kind: ScaledObject
metadata:
  name: queue-scaler
spec:
  scaleTargetRef:
    name: worker
  minReplicaCount: 1
  maxReplicaCount: 30
  triggers:
    - type: prometheus
      metadata:
        serverAddress: http://prometheus.monitoring.svc.cluster.local:9090
        query: sum(tasks_pending_total)
        threshold: "100"
---
# VPA to optimize resource allocation per worker
apiVersion: autoscaling.k8s.io/v1
kind: VerticalPodAutoscaler
metadata:
  name: worker-vpa
spec:
  targetRef:
    apiVersion: apps/v1
    kind: Deployment
    name: worker
  updatePolicy:
    updateMode: "Initial" # Update on scale events
KEDA handles the “how many workers” question, VPA handles the “how big should each worker be” question. Perfect combo for background processing workloads.
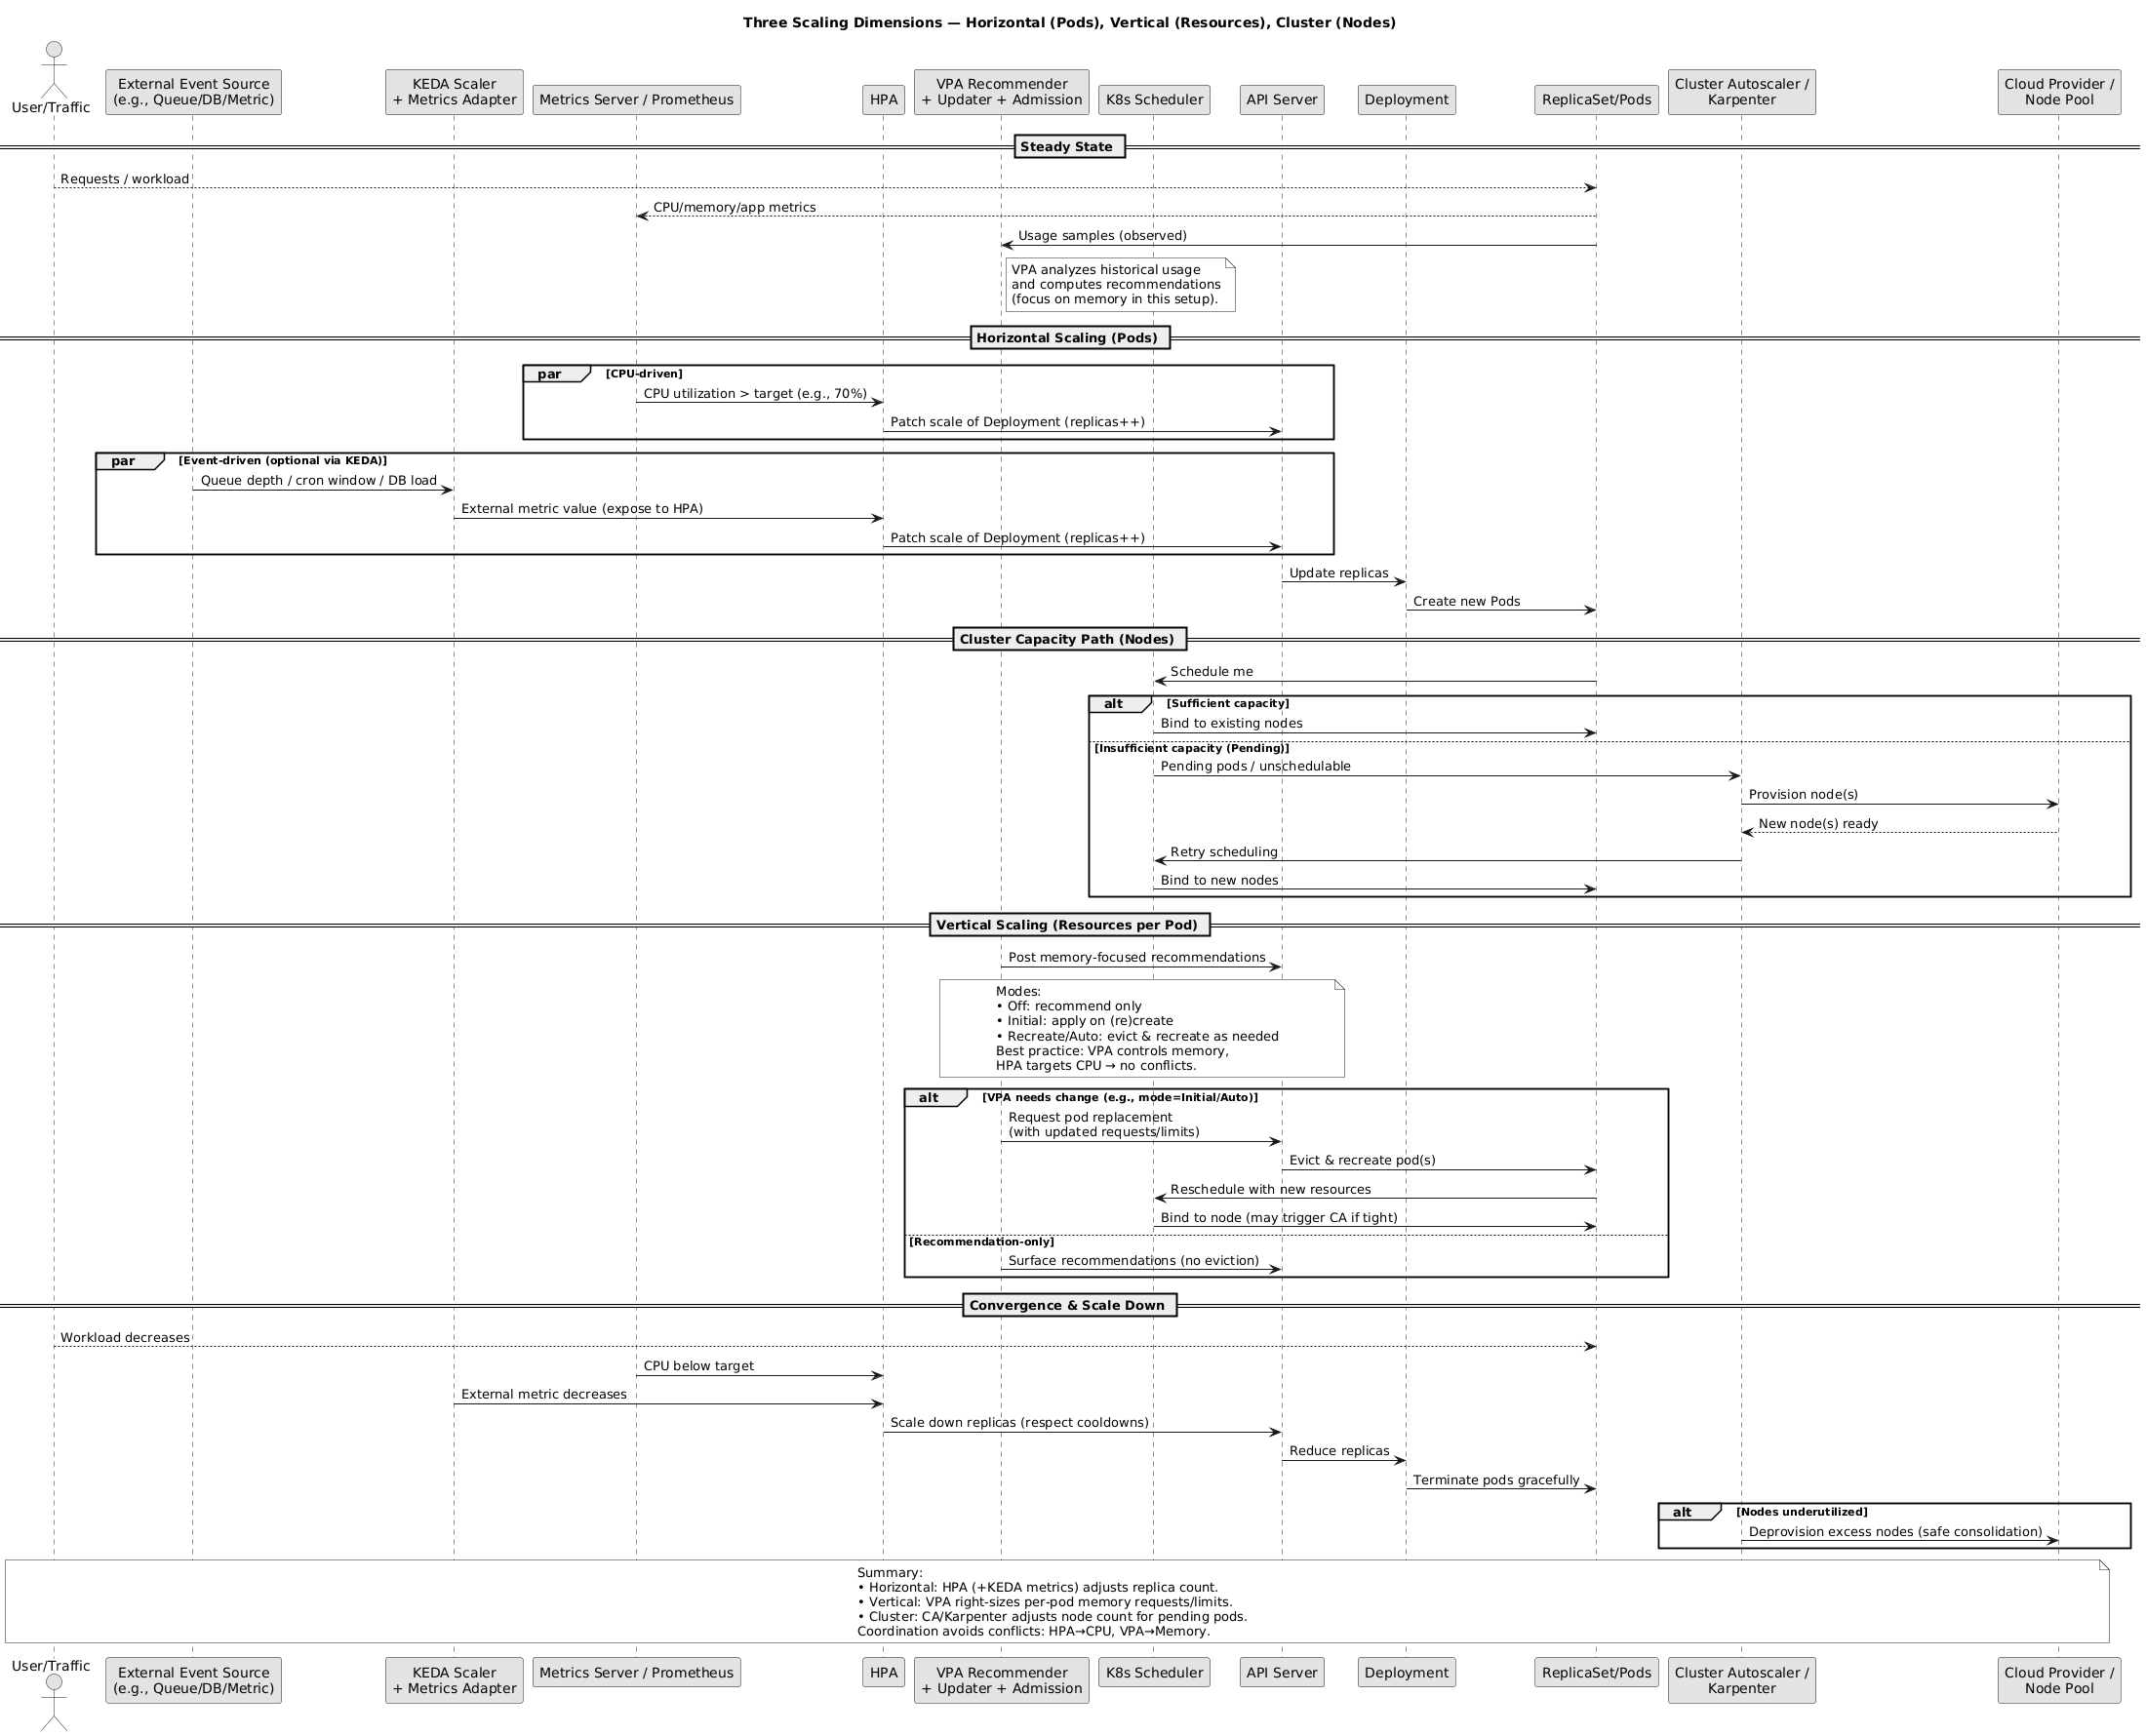
Strategy 3: Three-Tier Autoscaling (KEDA + VPA + Karpenter)#
For complete infrastructure efficiency:
- KEDA: Scales pods based on events
- VPA: Optimizes resource requests per pod
- Karpenter: Provisions nodes to accommodate pods
# 1. KEDA ScaledObject
apiVersion: keda.sh/v1alpha1
kind: ScaledObject
metadata:
  name: complete-scaler
spec:
  scaleTargetRef:
    name: processor
  minReplicaCount: 0
  maxReplicaCount: 100
  triggers:
    - type: prometheus
      metadata:
        serverAddress: http://prometheus.monitoring.svc.cluster.local:9090
        query: sum(workload_queue_depth)
        threshold: "50"
---
# 2. VPA for resource optimization
apiVersion: autoscaling.k8s.io/v1
kind: VerticalPodAutoscaler
metadata:
  name: processor-vpa
spec:
  targetRef:
    apiVersion: apps/v1
    kind: Deployment
    name: processor
  updatePolicy:
    updateMode: "Auto"
---
# 3. Karpenter NodePool (from previous setup)
# Automatically provisions nodes as KEDA scales pods
Observability and Monitoring#
KEDA Metrics#
KEDA exposes Prometheus metrics for monitoring:
# Check if scalers are active (1 = active, 0 = inactive)
keda_scaler_active

# Scaling errors
rate(keda_scaled_object_errors_total[5m])

# Current metric value per scaler
keda_scaler_metrics_value

# Count active scaled objects
count(keda_scaler_active == 1)

# Number of replicas per ScaledObject (use standard Kubernetes metrics)
kube_deployment_status_replicas
Note: KEDA 2.17+ uses updated metric names. Ensure your Prometheus has a ServiceMonitor configured to scrape KEDA operator metrics from the
kube-systemnamespace.
Setting up KEDA Metrics Scraping:
To enable Prometheus to scrape KEDA metrics, create a ServiceMonitor:
apiVersion: monitoring.coreos.com/v1
kind: ServiceMonitor
metadata:
  name: keda-operator
  namespace: kube-system
  labels:
    app.kubernetes.io/name: keda-operator
spec:
  selector:
    matchLabels:
      app.kubernetes.io/name: keda-operator
  endpoints:
    - port: metrics
      interval: 30s
      path: /metrics
This allows Prometheus to discover and scrape KEDA metrics, making them available for Grafana dashboards and alerting rules.
VPA Metrics#
Monitor VPA recommendations and updates:
# Get current recommendations
kubectl get vpa -o jsonpath='{range .items[*]}{.metadata.name}{"\t"}{.status.recommendation.containerRecommendations[0].target}{"\n"}{end}'

# Monitor VPA updater events
kubectl get events --field-selector involvedObject.kind=VerticalPodAutoscaler
Prometheus Alerting Rules#
Deploy these alerts to detect autoscaling issues:
groups:
  - name: keda_alerts
    interval: 30s
    rules:
      - alert: KEDAScalerErrors
        expr: rate(keda_scaled_object_errors_total[5m]) > 0.1
        for: 10m
        labels:
          severity: warning
        annotations:
          summary: "KEDA scaler {{ $labels.scaledObject }} experiencing errors"
          description: "Scaler {{ $labels.scaler }} has failed {{ $value }} times in the last 5 minutes"

      - alert: KEDAScalerDown
        expr: up{job="keda-metrics-apiserver"} == 0
        for: 5m
        labels:
          severity: critical
        annotations:
          summary: "KEDA metrics server is down"
          description: "KEDA cannot provide metrics to HPA. Autoscaling is disabled."

      - alert: KEDAScalingStuck
        expr: |
          (keda_scaler_metrics_value > 0)
          and (keda_scaler_active == 1)
          and (kube_deployment_status_replicas{namespace="demo"} <= 2)
        for: 15m
        labels:
          severity: warning
        annotations:
          summary: "ScaledObject {{ $labels.scaledObject }} stuck at minReplicas"
          description: "Metrics indicate scaling should occur, but replicas remain at minimum"

  - name: vpa_alerts
    interval: 60s
    rules:
      - alert: VPARecommendationDeviation
        expr: |
          (kube_pod_container_resource_requests_memory_bytes /
           vpa_recommendation_target) > 1.5 or
          (kube_pod_container_resource_requests_memory_bytes /
           vpa_recommendation_target) < 0.5
        for: 1h
        labels:
          severity: info
        annotations:
          summary: "VPA recommendation differs significantly from current requests"
          description: "Pod {{ $labels.pod }} memory requests deviate >50% from VPA target"

      - alert: HighOOMKillRate
        expr: rate(container_memory_failures_total{failure_type="oom"}[10m]) > 0
        for: 5m
        labels:
          severity: critical
        annotations:
          summary: "Container {{ $labels.container }} experiencing OOM kills"
          description: "VPA may need adjustment or application has memory leak"

      - alert: VPAEvictionRateTooHigh
        expr: rate(kube_pod_deletion_timestamp{reason="EvictedByVPA"}[1h]) > 5
        for: 30m
        labels:
          severity: warning
        annotations:
          summary: "VPA evicting pods too frequently for {{ $labels.deployment }}"
          description: "More than 5 pods/hour evicted. Consider using 'Initial' mode or adjusting boundaries"
SLO/SLI Recommendations for Autoscaling#
Define Service Level Objectives for your autoscaling system:
| SLI (Service Level Indicator) | SLO Target | Measurement | Why It Matters |
|---|---|---|---|
| Scaling Latency | 95% of scale-up events complete within 2 minutes | histogram_quantile(0.95, scaling_duration_seconds) | Users experience degraded performance during slow scale-up |
| Scaler Availability | 99.5% uptime for KEDA metrics server | avg_over_time(up{job="keda-metrics-apiserver"}[30d]) | Scaler failures prevent autoscaling, causing incidents |
| VPA Recommendation Accuracy | Resource recommendations within 20% of actual usage | abs((vpa_target - actual_usage) / actual_usage) | Inaccurate VPA causes OOMKills or wasted resources |
| Scale-to-Zero Success Rate | 99% of idle workloads scale to zero within cooldown period | Count successful vs. stuck scale-downs | Cost optimization goal not met if scale-to-zero fails |
| OOMKill Rate | < 0.1% of pod restarts due to OOM | rate(container_memory_failures_total{failure_type="oom"}[7d]) | Indicates VPA recommendations are too low |
Example SLO Dashboard Query (Prometheus):
# Scaling latency P95
histogram_quantile(0.95,
  rate(keda_scaling_duration_seconds_bucket[5m])
)

# KEDA metrics server uptime (30-day)
avg_over_time(up{job="keda-metrics-apiserver"}[30d]) * 100

# VPA accuracy: percentage of pods within 20% of target
100 * (
  count(
    abs(kube_pod_container_resource_requests_memory_bytes - vpa_recommendation_target)
    / vpa_recommendation_target < 0.2
  )
  / count(kube_pod_container_resource_requests_memory_bytes)
)
Grafana Dashboards#
Essential panels for autoscaling observability:
| Panel | Metric | Purpose |
|---|---|---|
| KEDA Scaling Activity | kube_deployment_status_replicas by deployment | Track replica changes |
| KEDA Scaler Status | keda_scaler_active, keda_scaler_metrics_value | Monitor active scalers |
| VPA Recommendations | VPA status API | Monitor resource adjustments |
| Cost Impact | Node cost × resource usage | Calculate savings |
| Scaling Latency | Event timestamp to pod ready | Measure responsiveness |
| SLO Compliance | See SLO table above | Track autoscaling reliability |
Tip: Check the demo repository for a complete KEDA Overview dashboard with working queries for KEDA 2.17+.
Testing Autoscaling in Non-Production Environments#
Before deploying autoscaling to production, validate behavior in staging or dev environments:
Load Testing Strategy#
# Example: Load test KEDA-scaled application
# Install k6 or hey for HTTP load testing
hey -z 5m -c 100 -q 50 https://staging.example.com/api

# Monitor scaling behavior
watch kubectl get hpa,scaledobject,pods -n staging

# Check KEDA metrics
kubectl get scaledobject my-app -n staging -o jsonpath='{.status.externalMetricNames}'
Validation Checklist#
| Test Scenario | What to Validate | Success Criteria |
|---|---|---|
| Scale Up | Pods increase under load | Replicas reach expected count within 60s |
| Scale Down | Pods decrease after load drops | Cooldown period respected, gradual scale down |
| Scale to Zero | Pods terminate during idle | All pods removed after cooldown period |
| VPA Recommendations | Resource adjustments are reasonable | Recommendations within 20% of actual usage |
| Fallback Activation | KEDA switches to fallback replicas | Monitor keda_scaled_object_errors_total for fallback triggers |
| PDB Compliance | VPA respects PodDisruptionBudgets | No more than N pods evicted simultaneously |
Staged Rollout Approach#
- Dev/Staging: Test with
updateMode: "Off"for VPA, validate KEDA scaler connections - Canary: Deploy to 10% of production pods, monitor for 24-48 hours
- Production: Gradually increase coverage, starting with non-critical workloads
- Critical Services: Only enable after observing behavior on similar workloads
Blast Radius Protection#
Limit the impact of aggressive scaling with gradual rollout:
apiVersion: keda.sh/v1alpha1
kind: ScaledObject
metadata:
  name: gradual-scaler
spec:
  scaleTargetRef:
    name: critical-api
  minReplicaCount: 10
  maxReplicaCount: 100
  advanced:
    horizontalPodAutoscalerConfig:
      behavior:
        scaleUp:
          stabilizationWindowSeconds: 60 # Wait 60s before scaling up
          policies:
            - type: Percent
              value: 50 # Scale up by max 50% at a time
              periodSeconds: 60
        scaleDown:
          stabilizationWindowSeconds: 300 # Wait 5 min before scaling down
          policies:
            - type: Pods
              value: 5 # Remove max 5 pods at a time
              periodSeconds: 60
Why this matters: Without rate limiting, a sudden spike in metrics could scale from 10 to 100 replicas instantly, potentially overwhelming downstream dependencies or causing cascading failures.
Common Pitfalls and Best Practices#
KEDA Best Practices#
| Practice | Why | How | Alert Threshold |
|---|---|---|---|
| Set Reasonable Limits | Prevent runaway scaling | Use maxReplicaCount conservatively | N/A |
| Configure Cooldown | Avoid scaling thrashing | Set cooldownPeriod: 300 (5 min) | N/A |
| Monitor Scaler Health | Detect connection issues | Alert on keda_scaled_object_errors_total | rate(keda_scaled_object_errors_total[5m]) > 0.1 |
| Use Authentication | Secure external connections | Define TriggerAuthentication resources | N/A |
| Test Scale-to-Zero | Ensure graceful shutdown | Verify application handles SIGTERM | N/A |
| Monitor Scaling Lag | Detect slow scale-up | Alert on time from trigger to pod ready | > 120s for critical services |
VPA Best Practices#
| Practice | Why | How | Alert Threshold |
|---|---|---|---|
| Start with “Off” Mode | Understand recommendations | Review suggestions before auto-apply | N/A |
| Avoid with HPA (CPU) | Prevent scaling conflicts | Use VPA for memory, HPA for CPU | N/A |
| Set Min/Max Boundaries | Prevent extreme values | Define minAllowed and maxAllowed | N/A |
| Use “Initial” for StatefulSets | Avoid data disruption | Only update on pod creation | N/A |
| Monitor OOMKills | Validate VPA effectiveness | Track container_memory_failures_total | rate(container_memory_failures_total[5m]) > 0 |
| Track Eviction Rate | Prevent excessive churn | Monitor VPA-triggered pod restarts | > 5 evictions/hour per deployment |
Anti-Patterns to Avoid#
| Anti-Pattern | Why It Fails | Correct Approach |
|---|---|---|
| Using HPA and VPA on same metric | Creates scaling conflicts and resource thrashing | Use HPA for CPU, VPA for memory only |
| No resource boundaries in VPA | Can cause excessive resource allocation or OOMKills | Always define minAllowed and maxAllowed |
| KEDA scaling without monitoring | Scaling failures go unnoticed, SLO violations | Set up alerts on keda_scaled_object_errors_total |
| VPA “Auto” mode on stateful apps | Pod evictions cause data disruption and downtime | Use “Initial” or “Off” mode for databases |
| Ignoring cooldown periods | Rapid scale up/down wastes resources and money | Configure appropriate cooldownPeriod values |
| Missing authentication for scalers | Security vulnerabilities and unauthorized access | Always use TriggerAuthentication for external sources |
| VPA without PodDisruptionBudgets | Excessive pod evictions during updates cause outages | Define PDBs with minAvailable to maintain availability |
Troubleshooting Common Issues#
| Issue | Symptom | Root Cause | Solution |
|---|---|---|---|
| KEDA not scaling | Pods remain at minReplicas despite metrics | Scaler connection failure, incorrect query | Check logs: kubectl logs -n keda deploy/keda-operatorVerify scaler config and credentials |
| VPA recommendations ignored | Pods not updated after VPA changes | Admission controller not running | Verify: kubectl get pods -n kube-system | grep vpa-admissionCheck admission webhook config |
| Scaling thrashing | Rapid scale up/down cycles | Cooldown period too short, conflicting metrics | Increase cooldownPeriod to 300sReview HPA behavior policies |
| OOMKills after VPA update | Pods crash with out-of-memory | VPA underestimated requirements | Check minAllowed boundariesReview actual usage vs. VPA target |
| KEDA fallback not activating | Pods stuck at minReplicas during scaler failure | failureThreshold not reached | Lower failureThreshold to 3Check keda_scaled_object_errors_total |
| Scale-to-zero not working | Pods remain at 1 replica during idle | Metrics never reach zero, min replicas set | Verify query returns 0 during idle Set minReplicaCount: 0 |
| VPA evicting too many pods | Service degradation during VPA updates | No PodDisruptionBudget configured | Add PDB with minAvailable: 2Use updateMode: "Initial" for critical apps |
| HPA and VPA conflict | Resource thrashing, unstable replica count | Both managing same metric (CPU) | Use HPA for CPU, VPA for memory only Set controlledResources: ["memory"] in VPA |
Debugging Commands#
# Check KEDA scaler status
kubectl get scaledobject -n demo -o wide
kubectl describe scaledobject my-app -n demo

# View KEDA operator logs
kubectl logs -n keda deploy/keda-operator --tail=100 -f

# Check HPA created by KEDA
kubectl get hpa -n demo
kubectl describe hpa keda-hpa-my-app -n demo

# View VPA recommendations
kubectl describe vpa my-app-vpa
kubectl get vpa my-app-vpa -o jsonpath='{.status.recommendation.containerRecommendations[0]}'

# Check VPA admission controller logs
kubectl logs -n kube-system deploy/vpa-admission-controller --tail=50

# Monitor scaling events
kubectl get events -n demo --sort-by='.lastTimestamp' | grep -E 'Scaled|Evicted'

# Test scaler connectivity (PostgreSQL example)
kubectl run psql-test --rm -it --image=postgres:15 -- \
  psql "postgresql://user:pass@host:5432/db" -c "SELECT COUNT(*) FROM table"

# Check KEDA metrics server health
kubectl get apiservice v1beta1.external.metrics.k8s.io -o yaml
Common Scaler-Specific Issues#
PostgreSQL/MySQL Scaler:
- Connection refused: Verify network policies allow KEDA pod → database
- Authentication failed: Check
TriggerAuthenticationsecret exists and is correct - Query returns null: Ensure query always returns a numeric value (use
COALESCE(COUNT(*), 0))
Prometheus Scaler:
- No metrics returned: Verify Prometheus is accessible from KEDA namespace
- Incorrect threshold: Test query in Prometheus UI first to validate results
- High cardinality: Avoid queries with too many time series (use aggregation)
Cron Scaler:
- Wrong timezone: Explicitly set
timezonemetadata (default is UTC) - Doesn’t scale down: Verify
endschedule is set, not juststart - Overlapping schedules: Use separate ScaledObjects for different time windows
Installation and Setup#
Installing KEDA#
Note: The demo repository includes complete Terraform modules and Helm values for production deployments on AKS (Azure Kubernetes Service).
# Add KEDA Helm repository
helm repo add kedacore https://kedacore.github.io/charts
helm repo update

# Install KEDA
helm install keda kedacore/keda \
  --namespace keda \
  --create-namespace \
  --set prometheus.metricServer.enabled=true \
  --set prometheus.operator.enabled=true
Verify installation:
kubectl get pods -n keda
# Expected output:
# keda-operator-*
# keda-metrics-apiserver-*
Installing VPA#
# Clone VPA repository
git clone https://github.com/kubernetes/autoscaler.git
cd autoscaler/vertical-pod-autoscaler

# Install VPA components
./hack/vpa-up.sh
Verify installation:
kubectl get pods -n kube-system | grep vpa
# Expected output:
# vpa-admission-controller-*
# vpa-recommender-*
# vpa-updater-*
Alternatively, use Helm:
helm repo add fairwinds-stable https://charts.fairwinds.com/stable
helm install vpa fairwinds-stable/vpa \
  --namespace vpa \
  --create-namespace
Setting Up TriggerAuthentication (Security Best Practice)#
For PostgreSQL example:
apiVersion: v1
kind: Secret
metadata:
  name: postgres-secret
  namespace: demo
type: Opaque
stringData:
  connectionString: postgresql://user:password@postgres.production.svc.cluster.local:5432/dbname
---
apiVersion: keda.sh/v1alpha1
kind: TriggerAuthentication
metadata:
  name: postgres-trigger-auth
  namespace: demo
spec:
  secretTargetRef:
    - parameter: connectionString
      name: postgres-secret
      key: connectionString
Then reference it in your ScaledObject:
triggers:
  - type: postgresql
    metadata:
      query: "SELECT COUNT(*) FROM ..."
      targetQueryValue: "100"
    authenticationRef:
      name: postgres-trigger-auth # Reference the TriggerAuthentication
This keeps credentials out of your YAML manifests and allows you to rotate secrets without modifying ScaledObjects.
Use Cases by Workload Type#
| Workload Type | Recommended Strategy | Rationale |
|---|---|---|
| Web APIs | HPA (CPU) + VPA (memory) | Traffic-driven horizontal scaling, optimize resource allocation |
| Database-Heavy Apps | KEDA (PostgreSQL/MySQL) + VPA | Scale based on DB load, optimize per-pod resources |
| Batch Jobs | KEDA ScaledJob (MySQL/Postgres) | Process pending records, scale-to-zero capability |
| Time-Based Workloads | KEDA (Cron) + VPA | Business hours scaling, cost optimization |
| Databases | VPA (Initial mode only) | Vertical optimization without disruption |
| ML Inference | KEDA (HTTP metrics) + scale-to-zero | On-demand scaling, eliminate idle costs |
| Microservices | KEDA (Prometheus) + VPA + Karpenter | Complete infrastructure efficiency |
Conclusion#
HPA gets you started, but KEDA and VPA take autoscaling to where it needs to be for real production workloads. KEDA lets you scale on actual business metrics like database load, time windows, HTTP traffic, whatever drives your app. VPA stops the resource guessing game and automatically right-sizes your pods.
Here’s how I think about using them together:
- HPA for basic CPU-driven web traffic
- KEDA when you need event-driven or scheduled scaling
- VPA to optimize resource requests across everything
- Karpenter to tie it all together at the node level
Start small. Enable VPA in “Off” mode first. Just watch what it recommends. Then try KEDA on a non-critical workload, maybe something that processes batch jobs. See how it behaves, tune the thresholds, then expand from there.
The mistake I see teams make is trying to implement everything at once. Pick one use case, get it working well, learn from it, then move to the next. Monitor the impact on both performance and cost. Those numbers will guide your next moves.
If you want to try this out, I have put together a demo repo with working examples for all the patterns we covered. It’s got PostgreSQL scaling, cron-based workloads, Prometheus metrics, and the full HPA+KEDA+VPA integration. Link’s above.
Autoscaling in Kubernetes doesn’t have to be complicated. These tools make it almost boring, and boring is exactly what you want in production.
Ready to implement? Check out the complete demo repository with working examples, load testing, and infrastructure templates: