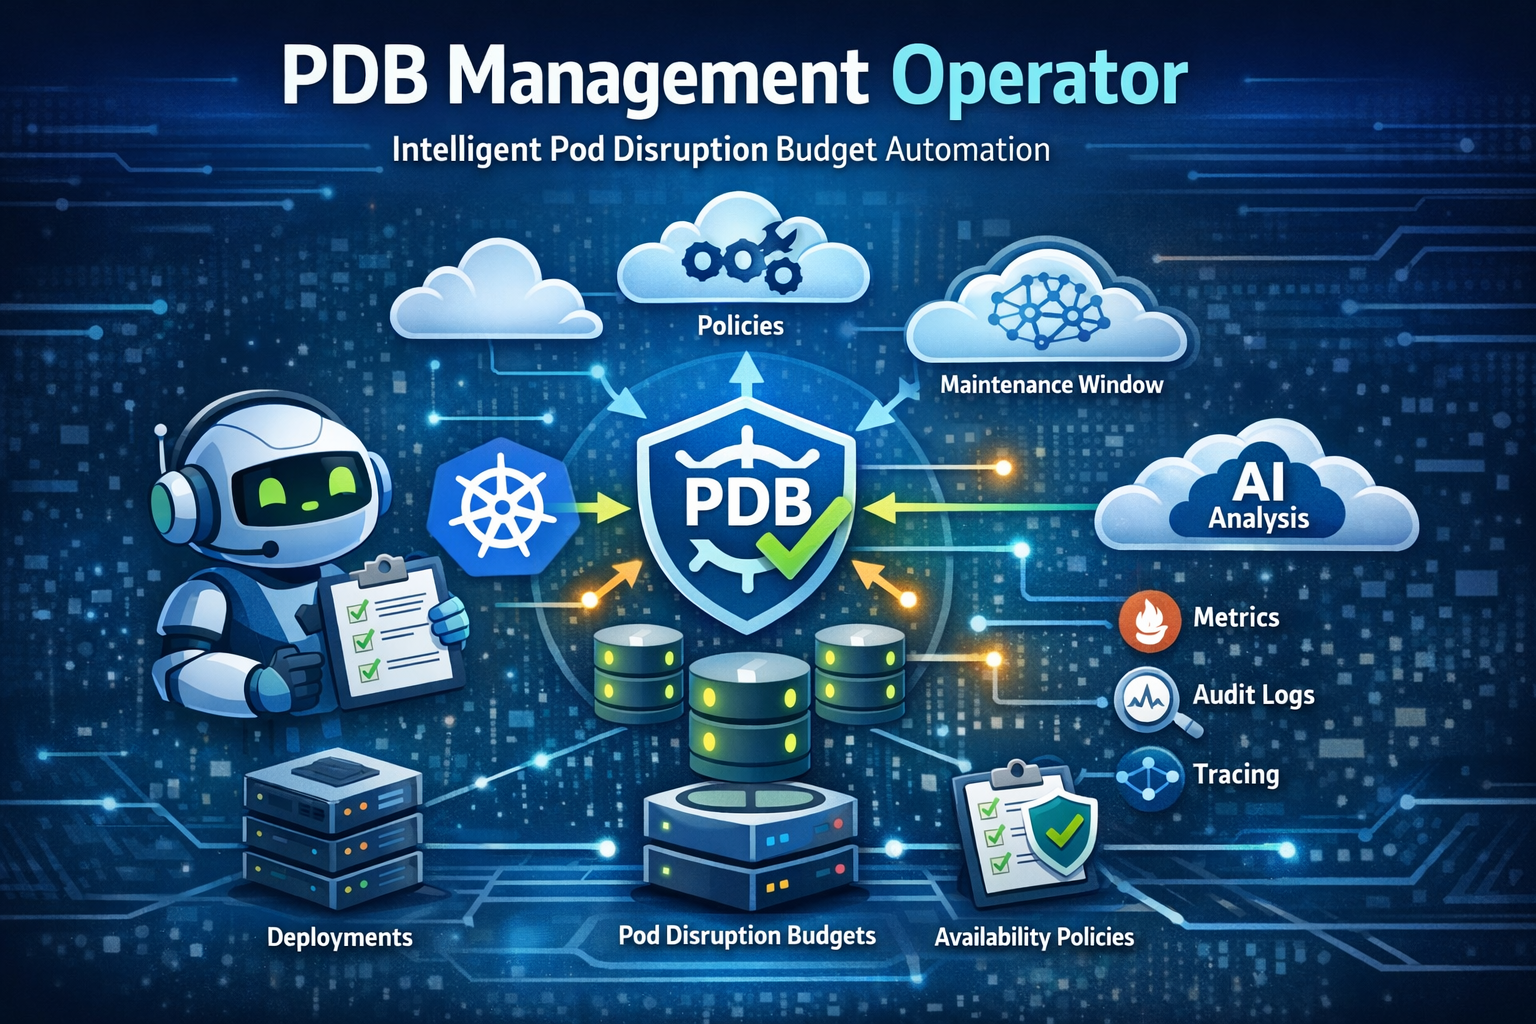
PDB Management Operator - Intelligent Pod Disruption Budget Automation for Kubernetes
// Learn how to automate Pod Disruption Budget management in Kubernetes using the PDB Management Operator. This guide explores the operator's architecture, dual configuration model, enforcement modes, and demonstrates how to use it for enterprise-grade availability management in ODA Canvas environments.
Pod Disruption Budgets (PDBs) are critical for maintaining application availability during voluntary disruptions like node drains, cluster upgrades, or autoscaler operations. Yet in practice, PDB management often becomes an afterthought - teams either forget to create them, configure them incorrectly, or struggle to maintain consistency across hundreds of deployments.
The PDB Management Operator solves this problem by automating PDB lifecycle management based on availability requirements, organizational policies, and component functions. Originally developed as a personal project, I donated it to the TM Forum ODA Canvas project to help telcos and enterprises manage availability at scale.
What is TM Forum ODA Canvas?#
While the PDB Management Operator works standalone in any Kubernetes cluster, I chose to donate it to the TM Forum ODA Canvas project where it addresses a critical need for telecom-grade availability management. Let me explain why this makes sense.
The TM Forum is a global industry association for digital business, with over 850 member companies including major telcos like Vodafone, AT&T, and Deutsche Telekom. They develop open standards and best practices for the telecommunications industry.
The Open Digital Architecture (ODA) is TM Forum’s blueprint for modular, cloud-native telecom software. It defines how telecom applications should be built, deployed, and managed using standardized components and APIs.
ODA Canvas is the reference implementation of the ODA runtime environment - a Kubernetes-based platform that:
- Manages ODA Components: Lifecycle management for standardized telecom software components
- Exposes APIs: Automatic API gateway integration for TMF Open APIs
- Handles Identity: Authentication and authorization for components
- Ensures Availability: Where the PDB Management Operator comes in
flowchart TB
    subgraph Canvas["ODA Canvas"]
        subgraph Operators["Canvas Operators"]
            CompOp["Component Operator"]
            APIGw["API Operator"]
            Identity["Identity Operator"]
            PDB["PDB Management Operator"]
        end

        subgraph Components["ODA Components"]
            TMF620["TMF620<br/>Product Catalog"]
            TMF622["TMF622<br/>Product Ordering"]
            TMF629["TMF629<br/>Customer Management"]
        end
    end

    CompOp -->|manages lifecycle| Components
    APIGw -->|exposes APIs| Components
    Identity -->|authenticates| Components
    PDB -->|ensures availability| Components
The PDB Management Operator is one of several operators that make up the ODA Canvas, specifically focused on ensuring component availability during cluster operations.
Who Should Read This?#
This post is for:
- SREs managing large Kubernetes deployments who want automated PDB management
- Platform Engineers building internal developer platforms with availability guarantees
- DevOps Teams in regulated environments needing audit trails and policy enforcement
- Organizations using ODA Canvas who need enterprise-grade availability management
If you’re tired of manually creating PDBs or dealing with inconsistent availability configurations across your clusters, read on.
What is the PDB Management Operator?#
The PDB Management Operator is a Kubernetes operator built with Operator SDK in Go that automatically creates, updates, and manages Pod Disruption Budgets based on deployment annotations and organizational policies.
Unlike simple admission controllers or Helm hooks, this operator provides:
- Dual Configuration Model: Both annotation-based (developer-friendly) and policy-based (platform team control) approaches
- Intelligent Enforcement: Three modes that balance flexibility with governance
- Component-Aware Logic: Automatic availability upgrades for security-critical workloads
- Full Lifecycle Management: Creates, updates, and deletes PDBs as deployments change
- Enterprise Observability: Prometheus metrics, OpenTelemetry tracing, and structured audit logs
Why Not Just Use Kyverno or OPA Gatekeeper?#
A common question: “Why a dedicated operator instead of policy engines?” Here’s the distinction:
| Aspect | Kyverno/Gatekeeper | PDB Management Operator |
|---|---|---|
| Primary Focus | Admission control (validate/mutate) | Full lifecycle management |
| Policy Conflicts | Block or warn at admission | Priority-based resolution with tie-breaking |
| Maintenance Windows | Not supported | Built-in time-based PDB suspension |
| Component Intelligence | Manual configuration | Automatic function detection |
| Observability | Basic metrics | Full tracing, metrics, audit logs |
| Reconciliation | None (admission only) | Continuous drift detection and correction |
Bottom line: Policy engines are great for validation, but they can’t manage PDB lifecycle, handle maintenance windows, or reconcile drift. In practice, this means you can use them together, the operator creates PDBs, policy engines validate them.
What This Operator Is Not#
To set clear expectations:
- Not a policy engine replacement - Use alongside Kyverno or OPA Gatekeeper, not instead of them
- Not for single-replica workloads - PDBs require 2+ replicas to be meaningful
- Not a StatefulSet controller (yet) - Today it focuses on Deployments; StatefulSet support is on the roadmap
- Not a service mesh - Does not handle traffic management or circuit breaking
Core Concepts#
flowchart TB
    subgraph Inputs["Configuration Sources"]
        Annotations["Deployment Annotations<br/>oda.tmforum.org/availability-class"]
        Policies["AvailabilityPolicy CRD<br/>Organization-wide rules"]
    end

    subgraph Operator["PDB Management Operator"]
        Controller["Deployment Controller"]
        PolicyCache["Policy Cache"]
        Resolver["Configuration Resolver"]
    end

    subgraph Outputs["Managed Resources"]
        PDB["Pod Disruption Budget<br/>Auto-created & managed"]
        Events["Kubernetes Events<br/>Audit trail"]
        Metrics["Prometheus Metrics<br/>Observability"]
    end

    Annotations --> Controller
    Policies --> PolicyCache
    PolicyCache --> Resolver
    Controller --> Resolver
    Resolver --> PDB
    Controller --> Events
    Controller --> Metrics
The operator watches Deployments and AvailabilityPolicy resources, resolves the appropriate configuration based on enforcement rules, and manages the corresponding PDB.
Availability Classes#
The operator uses predefined availability classes defined as percentages, then converts them to integer minAvailable values based on replica count:
| Class | Core/Management | Security | Description |
|---|---|---|---|
non-critical | 20% | 50% | Development, batch jobs, testing workloads |
standard | 50% | 75% | Typical production microservices |
high-availability | 75% | 75% | Stateful apps, databases, message queues |
mission-critical | 90% | 90% | Critical infrastructure, payment systems |
custom | User-defined | User-defined | Full control over PDB configuration |
The classes are defined as percentages, but the operator converts them to integer minAvailable values based on each workload’s replica count.
Note: Security components (detected via annotations or naming patterns) are automatically upgraded to higher availability levels. In practice, this means an auth-service marked as non-critical will receive standard level protection (50% instead of 20%) - the operator assumes security workloads should never have minimal availability.
Configuration Model#
Annotation-Based Configuration#
The simplest approach developers add annotations to their deployments:
apiVersion: apps/v1
kind: Deployment
metadata:
  name: payment-api
  annotations:
    # Required: Availability class
    oda.tmforum.org/availability-class: "high-availability"

    # Optional: Component function (affects PDB calculation)
    oda.tmforum.org/component-function: "core"

    # Optional: Component name for identification
    oda.tmforum.org/componentName: "payment-service"

    # Optional: Maintenance window
    oda.tmforum.org/maintenance-window: "02:00-04:00 UTC"
spec:
  replicas: 6
  # ... rest of deployment spec
The operator automatically creates a PDB:
kubectl get pdb payment-api-pdb
# NAME              MIN AVAILABLE   MAX UNAVAILABLE   ALLOWED DISRUPTIONS   AGE
# payment-api-pdb   5               N/A               1                     5s
Note: The operator calculates
minAvailableas an integer (5 out of 6 replicas for 75%) to avoid percentage rounding ambiguity.
Policy-Based Configuration#
For platform teams who need organization-wide control:
apiVersion: availability.oda.tmforum.org/v1alpha1
kind: AvailabilityPolicy
metadata:
  name: production-security-policy
  namespace: canvas
spec:
  # Availability requirement
  availabilityClass: mission-critical

  # Enforcement behavior
  enforcement: strict
  priority: 1000 # Higher number = higher priority

  # Component selection
  componentSelector:
    componentFunctions: [security]
    namespaces: [production, staging]
    matchLabels:
      tier: critical

  # Maintenance windows
  maintenanceWindows:
    - start: "02:00"
      end: "04:00"
      timezone: "UTC"
      daysOfWeek: [0, 6] # Weekends only
Enforcement Modes#
The operator supports three enforcement modes that balance developer flexibility with platform governance:
Strict Enforcement#
Policy always wins annotations are ignored completely.
spec:
  enforcement: strict
  # Deployment annotations have no effect
Use Cases: Compliance requirements, security policies, regulated environments where platform teams must maintain control.
Flexible Enforcement#
Annotations accepted if they meet minimum requirements.
spec:
  enforcement: flexible
  minimumClass: standard # Annotations can be standard or higher
Behavior:
- Annotation >= minimum class: Annotation configuration used
- Annotation < minimum class: Minimum class enforced
Use Cases: Teams can opt for higher availability but can’t go below organizational standards.
Advisory Enforcement#
Annotations preferred with controlled override capabilities.
spec:
  enforcement: advisory
  allowOverride: true
  overrideRequiresReason: true # Must provide justification
Use Cases: Development environments, flexible policies with audit trails.
Policy Resolution & Tie-Breaking#
When multiple policies match a deployment, the operator uses deterministic resolution:
# Policy A: namespace-wide, priority 100
apiVersion: availability.oda.tmforum.org/v1alpha1
kind: AvailabilityPolicy
metadata:
  name: production-baseline
  namespace: canvas
spec:
  availabilityClass: standard
  priority: 100
  componentSelector:
    namespaces: [production]
---
# Policy B: security-focused, priority 1000
apiVersion: availability.oda.tmforum.org/v1alpha1
kind: AvailabilityPolicy
metadata:
  name: security-critical
  namespace: canvas
spec:
  availabilityClass: mission-critical
  priority: 1000
  componentSelector:
    componentFunctions: [security]
    namespaces: [production]
Resolution order:
- Priority wins - Higher priority policies take precedence (security-critical: 1000 > production-baseline: 100)
- Lexicographic tie-break - If priorities are equal, policies are sorted by
metadata.name(stable + deterministic) - Audit trail - Conflicts are logged and exposed via metrics (
pdb_management_policy_conflicts_total)
For a deployment in production namespace with component-function: security, Policy B wins because it has higher priority, even though both policies match.
Architecture#
flowchart TB
    subgraph Cluster["Kubernetes Cluster"]
        subgraph Controllers["Operator Controllers"]
            DeployCtrl["Deployment Controller"]
            PolicyCtrl["AvailabilityPolicy Controller"]
        end

        subgraph Cache["Caching Layer"]
            PolicyCache["Policy Cache<br/>5-min TTL"]
            StateCache["Deployment State<br/>Change Detection"]
        end

        subgraph Resources["Kubernetes Resources"]
            Deploy["Deployments"]
            PDB["PDBs"]
            Policy["AvailabilityPolicies"]
        end

        subgraph Observability["Observability"]
            Metrics["Prometheus Metrics"]
            Tracing["OpenTelemetry Traces"]
            Audit["Structured Audit Logs"]
        end
    end

    Deploy -->|watches| DeployCtrl
    Policy -->|watches| PolicyCtrl
    PolicyCtrl -->|invalidates| PolicyCache
    DeployCtrl -->|reads| PolicyCache
    DeployCtrl -->|checks| StateCache
    DeployCtrl -->|manages| PDB
    DeployCtrl -->|exports| Metrics
    DeployCtrl -->|sends| Tracing
    DeployCtrl -->|writes| Audit
Key Components#
| Component | Purpose |
|---|---|
| Deployment Controller | Watches deployments, resolves configuration, manages PDBs |
| AvailabilityPolicy Controller | Manages policy CRD lifecycle, updates status |
| Policy Cache | Caches policies for performance (5-min TTL) |
| State Cache | Fingerprint-based change detection to avoid unnecessary reconciliations |
| Event Recorder | Emits Kubernetes events for audit trail |
| Metrics Collector | Exports Prometheus metrics for monitoring |
PDB Management Operator: Pros and Cons#
Before implementing, let’s evaluate honestly.
Pros#
| Advantage | Description |
|---|---|
| Kubernetes-Native | Uses CRDs and controller patterns familiar to K8s operators |
| Dual Configuration | Supports both developer annotations and platform policies |
| Intelligent Resolution | Priority-based policy matching with deterministic tie-breaking |
| Security-Aware | Automatic availability upgrades for security components |
| Maintenance Windows | Built-in support for scheduled maintenance periods |
| Full Observability | Prometheus metrics, OpenTelemetry tracing, structured audit logs |
| ODA Canvas Integration | Native support for TM Forum ODA component architecture |
| MCP Integration | AI-powered cluster analysis via Model Context Protocol |
Cons#
| Limitation | Description |
|---|---|
| Learning Curve | New concepts (AvailabilityPolicy, enforcement modes) require documentation |
| Minimum Replicas | PDBs only created for deployments with 2+ replicas |
| Cache Latency | Policy changes may take up to 5 minutes to propagate |
| Webhook Dependencies | Validation webhooks require cert-manager |
Note on Policy Namespace: AvailabilityPolicies in the
canvasnamespace can affect deployments cluster-wide. This is by design: only platform administrators with access to thecanvasnamespace can create or modify cluster-wide availability policies, providing a clear separation between platform governance and application teams.
Operational Footprint#
For SREs concerned about control-plane impact:
- Memory: Typically tens of MB for the controller manager
- CPU: Minimal - reconciliation is event-driven, not polling-based
- API Server Load: Low - uses informer caches and 5-minute policy TTL to minimize API calls
- Reconcile Frequency: Only on deployment changes, policy updates, or PDB drift detection
In practice, this means the operator adds negligible overhead even in clusters with hundreds of deployments. See the demo repository for benchmark snapshots.
When to Use This Operator#
The PDB Management Operator is a strong fit when:
- You have 50+ deployments and manual PDB management is impractical
- You need policy enforcement across teams with different requirements
- You’re in a regulated environment requiring audit trails
- You use ODA Canvas or similar component-based architectures
- You want consistency without sacrificing developer flexibility
Practical Examples#
Example 1: Simple Deployment with Annotation#
apiVersion: apps/v1
kind: Deployment
metadata:
  name: catalog-api
  annotations:
    oda.tmforum.org/availability-class: "high-availability"
spec:
  replicas: 4
  selector:
    matchLabels:
      app: catalog-api
  template:
    metadata:
      labels:
        app: catalog-api
    spec:
      containers:
        - name: api
          image: catalog-api:v1.2.0
Result: PDB created with minAvailable: 3 (75% of 4 replicas), allowing 1 disruption.
Example 2: Security Service with Strict Policy#
# Policy (applied by platform team)
apiVersion: availability.oda.tmforum.org/v1alpha1
kind: AvailabilityPolicy
metadata:
  name: security-strict
  namespace: canvas
spec:
  availabilityClass: mission-critical
  enforcement: strict
  componentSelector:
    componentFunctions: [security]
  priority: 1000
---
# Deployment (created by developer)
apiVersion: apps/v1
kind: Deployment
metadata:
  name: auth-service
  annotations:
    oda.tmforum.org/component-function: "security"
    oda.tmforum.org/availability-class: "standard" # Ignored due to strict policy
spec:
  replicas: 5
  # ...
Result: PDB created with minAvailable: 5 (90% of 5 replicas rounds up to 5), meaning 0 allowed disruptions - the operator enforces maximum protection for security workloads under strict policy.
Example 3: Flexible Policy with Developer Override#
# Policy
apiVersion: availability.oda.tmforum.org/v1alpha1
kind: AvailabilityPolicy
metadata:
  name: production-flexible
  namespace: canvas
spec:
  availabilityClass: standard
  enforcement: flexible
  minimumClass: standard
  componentSelector:
    namespaces: [production]
---
# Deployment with higher availability
apiVersion: apps/v1
kind: Deployment
metadata:
  name: order-service
  namespace: production
  annotations:
    oda.tmforum.org/availability-class: "mission-critical" # Accepted (higher than minimum)
spec:
  replicas: 10
  # ...
Result: PDB created with minAvailable: 9 (90% of 10 replicas) - developer’s choice honored since it exceeds the minimum.
Example 4: TM Forum ODA Component#
apiVersion: apps/v1
kind: Deployment
metadata:
  name: tmf620-productcatalog
  namespace: components
  labels:
    oda.tmforum.org/componentName: productcatalog
    oda.tmforum.org/componentType: core
  annotations:
    oda.tmforum.org/availability-class: "high-availability"
    oda.tmforum.org/component-function: "core"
    oda.tmforum.org/api-specification: "TMF620-ProductCatalog-v4.0.0"
    oda.tmforum.org/maintenance-window: "02:00-04:00 UTC"
spec:
  replicas: 5
  # ...
Result: PDB created with minAvailable: 4 (75% of 5 replicas), automatically suspended during maintenance window (02:00-04:00 UTC).
Observability#
Key Metrics#
The operator exports comprehensive Prometheus metrics:
# PDB lifecycle
pdb_management_pdbs_created_total
pdb_management_pdbs_updated_total
pdb_management_pdbs_deleted_total

# Performance
pdb_management_reconciliation_duration_seconds
pdb_management_cache_hits_total
pdb_management_cache_misses_total

# Policy enforcement
pdb_management_enforcement_decisions_total
pdb_management_override_attempts_total
pdb_management_policy_conflicts_total

# Operator health
pdb_management_operator_info
pdb_management_maintenance_window_active
Structured Audit Logging#
Every PDB operation is logged with full context:
{
  "level": "info",
  "audit": {
    "action": "PDB_CREATED",
    "resource": "payment-service-pdb",
    "result": "success",
    "metadata": {
      "availabilityClass": "mission-critical",
      "enforcement": "strict",
      "policy": "security-policy",
      "durationMs": 142
    }
  }
}
Distributed Tracing#
Full OpenTelemetry integration for end-to-end visibility:
# Enable tracing
kubectl set env deployment/pdb-management-controller-manager -n canvas \
  ENABLE_TRACING=true \
  OTEL_EXPORTER_OTLP_ENDPOINT=http://jaeger:4317
AI-Powered Analysis with MCP#
The operator includes an integrated Model Context Protocol (MCP) server that enables AI assistants like Claude to analyze your cluster and provide intelligent recommendations.
Note: MCP integration is optional and does not affect core operator functionality. It is intended for platform teams exploring AI-assisted operations. You can safely ignore this feature if it doesn’t fit your workflow.
flowchart LR
    subgraph Clients["AI Clients"]
        Claude["Claude"]
        GPT["GPT"]
    end

    subgraph MCP["MCP Server :8090"]
        Tools["Analysis Tools"]
    end

    subgraph K8s["Kubernetes"]
        Deploy["Deployments"]
        PDB["PDBs"]
        Policy["Policies"]
    end

    Clients <-->|"JSON-RPC"| MCP
    MCP <-->|"K8s API"| K8s
Available MCP Tools#
| Tool | Purpose |
|---|---|
analyze_cluster_availability | Comprehensive PDB coverage analysis |
analyze_workload_patterns | Deployment pattern detection |
recommend_availability_classes | Optimal availability suggestions |
recommend_policies | Policy recommendations |
simulate_policy_impact | Preview policy changes |
Example Interactions#
Ask Claude to help with your cluster:
- “Analyze my cluster’s availability status”
- “What workload patterns do you see in my deployments?”
- “Recommend availability classes for my production services”
- “Simulate the impact of applying high-availability to all production deployments”
Installation#
Prerequisites#
- Kubernetes 1.21+
- cert-manager (for webhook TLS certificates)
Quick Deployment#
# Deploy to canvas namespace
kubectl create namespace canvas
kubectl apply -k config/default/

# Verify installation
kubectl get pods -n canvas
kubectl get crd | grep availability
Tip: If you hit kustomize version mismatches, use
kubectl kustomize config/default | kubectl apply -f -instead.
With Webhooks (Recommended for Production)#
# Install cert-manager first (use latest stable version for your environment)
kubectl apply -f https://github.com/cert-manager/cert-manager/releases/latest/download/cert-manager.yaml

# Deploy operator with webhooks
kubectl apply -k config/certmanager/
kubectl apply -k config/webhook/
kubectl apply -k config/default/

# Enable webhooks
kubectl patch deployment pdb-management-controller-manager -n canvas \
  --type='json' -p='[{"op": "replace", "path": "/spec/template/spec/containers/0/args", "value": ["--leader-elect", "--enable-webhook=true"]}]'
Tip: The demo repository handles cert-manager installation via
task setup- use that for a streamlined experience.
Troubleshooting#
Common Issues#
| Issue | Symptoms | Resolution |
|---|---|---|
| No PDB Created | Deployment has no PDB | Check replicas (must be >= 2), verify annotation spelling |
| Policy Conflicts | Unexpected availability class | Check kubectl get availabilitypolicy -A -o wide for priorities |
| Webhook Errors | Admission failures | Verify cert-manager and certificate status |
| Stale Configuration | Changes not applied | Wait for cache TTL (5 minutes) or restart operator |
Debug Mode#
# Enable debug logging
kubectl patch deployment pdb-management-controller-manager -n canvas \
  --type='json' -p='[{"op": "replace", "path": "/spec/template/spec/containers/0/args", "value": ["--leader-elect", "--log-level=debug"]}]'
Hands-On Demo Repository#
To see the PDB Management Operator in action within the full ODA Canvas environment, I’ve created a comprehensive demo repository:
What’s Included#
The demo deploys the complete ODA Canvas stack, not just the operator in isolation:
| Component | Purpose |
|---|---|
| ODA Canvas | Full TM Forum ODA Canvas installation |
| PDB Management Operator | The availability management operator |
| Sample ODA Components | TMF620, TMF622 reference implementations |
| AvailabilityPolicies | Example policies for different scenarios |
| Observability Stack | Prometheus + Grafana for metrics visualization |
Demo Scenarios#
The demo walks through real-world scenarios:
- Annotation-Based PDB Creation: Deploy a component with availability annotations
- Policy Enforcement: See how strict policies override developer annotations
- Flexible Mode: Demonstrate minimum class enforcement
- Maintenance Windows: Observe PDB suspension during scheduled maintenance
- MCP Integration: Use Claude to analyze cluster availability
Quick Start#
# Clone the demo repository
git clone https://github.com/NoNickeD/pdb-management-operator-demo.git
cd pdb-management-operator-demo

# Deploy full ODA Canvas with PDB Management Operator
task setup

# Deploy sample components
task deploy:components

# Create availability policies
task deploy:policies

# Watch PDBs being created
kubectl get pdb -A -w
This gives you a complete, working ODA Canvas environment to explore the operator’s capabilities.
Conclusion#
Managing Pod Disruption Budgets at scale requires more than just YAML templates - it requires intelligent automation that understands organizational policies, component criticality, and operational contexts like maintenance windows.
The PDB Management Operator provides this automation with:
- Dual configuration model for both developer flexibility and platform control
- Three enforcement modes to balance governance with agility
- Component intelligence that automatically protects security-critical workloads
- Enterprise observability for compliance and troubleshooting
- AI integration via MCP for intelligent cluster analysis
Whether you’re managing a handful of services or hundreds of ODA components, this operator ensures consistent, policy-driven availability management without the manual toil.
If you found this useful, you might also enjoy my related posts on Kubernetes operators and platform tooling:
- Mastering Kubernetes Customization with Operator SDK
- Kubernetes Multi-Tenancy with Capsule
- ArgoCD - GitOps for Kubernetes