Simplifying Kubernetes Observability with Inspector Gadget.
// Explore how Inspector Gadget leverages eBPF technology to simplify Kubernetes observability, providing tools reminiscent of traditional Linux commands for deep insights into cluster operations.
In the vast and ever-evolving Kubernetes ecosystem, the abundance of tools for observability can sometimes feel overwhelming. While these tools offer comprehensive insights into metrics, logs, and traces, there’s an undeniable charm in the simplicity of traditional Linux commands like netstat and ps. These commands provide a straightforward view of active connections and processes, respectively. For those of us who have transitioned from managing single servers to orchestrating containers at scale with Kubernetes, there’s a noticeable gap in the simplicity of inspecting what’s happening within our clusters.
The Challenge of Deep Inspection in Kubernetes#
Kubernetes, with its kubectl command-line tool, offers a high-level overview of resources within a cluster. You can list pods, view events, and access logs among other things. However, when the need arises to understand what’s happening at the kernel level or to inspect lower-level processes, kubectl falls short. This is understandable, given its reliance on the Kubernetes API. The alternative—logging into each node for a deeper dive—is impractical and often not feasible due to restricted access or the sheer number of nodes in a cluster.
Enter eBPF: A Bridge to Lower-Level Observability#
The Extended Berkeley Packet Filter (eBPF) technology presents a solution by allowing the safe injection of monitoring code directly into the kernel. This capability opens up possibilities for observing lower-level activities such as process execution, network traffic, and file system operations from within Kubernetes. However, leveraging eBPF effectively requires tools that can translate its powerful capabilities into something accessible for Kubernetes administrators.
Discovering Inspector Gadget: Kubernetes Troubleshooting Simplified#
Inspector Gadget is a revelation for those seeking to bridge the simplicity of Linux troubleshooting commands with the complexity of Kubernetes environments. It extends kubectl with a collection of tools that leverage eBPF for deep observability, all while maintaining an interface familiar to those accustomed to traditional Linux commands.
Deploying Inspector Gadget#
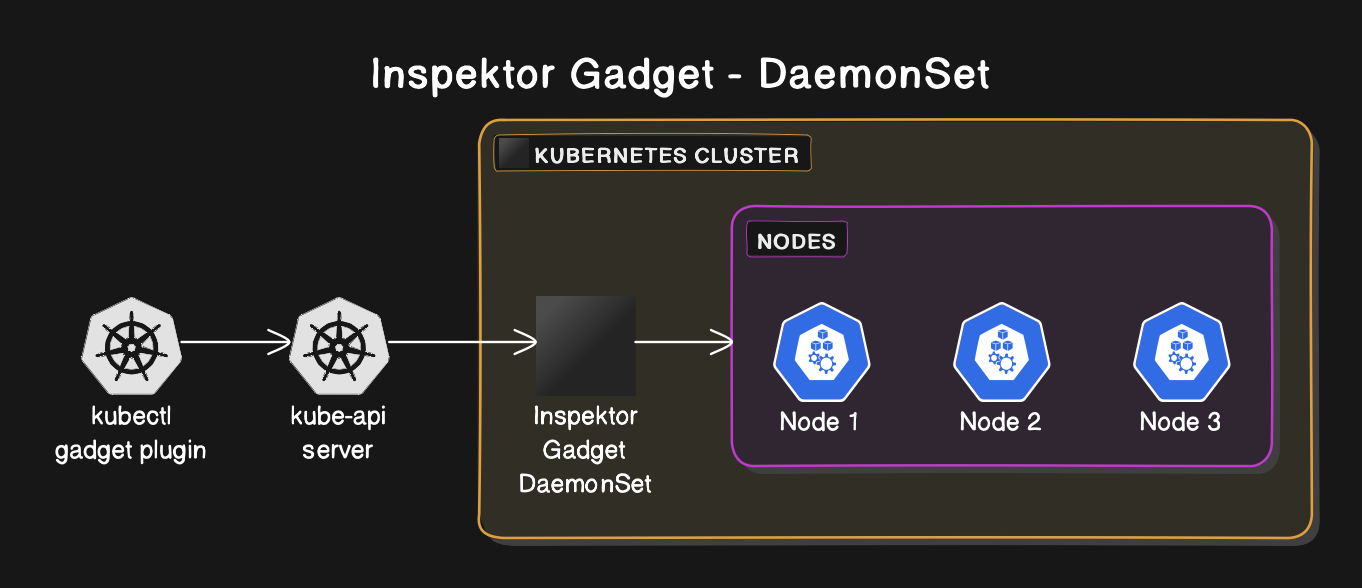
Deploying Inspektor Gadget to monitor and troubleshoot Kubernetes clusters can be accomplished through a couple of straightforward methods. The primary approach utilizes the kubectl gadget plugin, which simplifies the installation by interacting with the Kubernetes API server to orchestrate all necessary resources automatically. This method deploys Inspektor Gadget as a DaemonSet, ensuring it runs on each node in your cluster. Alternatively, administrators can manually apply the necessary manifests using kubectl commands.
This flexibility allows Inspektor Gadget to integrate seamlessly into diverse Kubernetes environments, catering to both automated setups and custom deployment strategies. After deployment, users leverage the kubectl gadget CLI to create and manage trace Custom Resource Definitions (CRDs), enabling detailed eBPF-based monitoring and debugging directly from the kernel level.
 Inspector Gadget DaemonSet
# Using krew
kubectl krew install gadget
kubectl gadget --help

# Quick installation
kubectl gadget deploy
Exploring Inspector Gadget’s Capabilities#
Inspector Gadget categorizes its commands into intuitive groups such as advice, audit, and profile. Each category contains commands that offer insights into different aspects of cluster behavior:
- Network Monitoring: Similar to
netstat, Inspector Gadget can monitor network traffic at the namespace level, providing valuable data for generating Kubernetes network policies based on actual traffic patterns.
kubectl gadget snapshot socket
- Process Snapshot: Offering functionality akin to the
pscommand, it can list processes running inside containers across all pods in a namespace.
kubectl gadget snapshot process
- Resource Usage: Commands like
topare reimagined to show resource consumption by eBPF programs, giving visibility into which processes are most resource-intensive.
kubectl gadget top ebpf
- File System Activity: Inspector Gadget can track file system operations, helping identify heavy read/write activities within the cluster.
kubectl gadget top file
For more information, check the demo in Github i have create for you.
Real-World Applications and Integration#
Beyond its standalone utility, Inspector Gadget’s metrics can be exported to Prometheus, integrating seamlessly into existing observability frameworks. Furthermore, tools like Kubescape utilize Inspector Gadget internally, underscoring its utility and versatility.
Conclusion: Embracing Simplicity in Kubernetes Observability#
Inspector Gadget stands out as a tool that marries the simplicity of Linux troubleshooting commands with the complex needs of Kubernetes observability. For SREs and Kubernetes administrators longing for a straightforward way to peer into their clusters, Inspector Gadget offers a compelling solution. Its ability to provide low-level insights while being Kubernetes-aware makes it an indispensable tool in the modern cloud-native stack.
As we continue to navigate the complexities of Kubernetes and cloud-native technologies, tools like Inspector Gadget remind us that simplicity and depth are not mutually exclusive. Embracing such tools can significantly enhance our understanding and management of Kubernetes environments.
 Simplifying Kubernetes Observability with Inspector Gadget