Deep Dive into Distributed Tracing with Grafana Tempo
If you’re aiming to strengthen your observability strategy with distributed tracing, Grafana Tempo might be your answer. As an SRE, incorporating Tempo into observability stacks has been invaluable, especially within Kubernetes and microservices environments. Tempo’s unique, cost-effective approach to tracing simplifies setup, leverages object storage, and provides seamless integration with the Grafana ecosystem. Let’s explore how Tempo works, its architecture, use cases, and the setup steps you’ll need to deploy it effectively.
What is Grafana Tempo?#
Grafana Tempo is an open-source, high-scale tracing backend built to streamline distributed tracing, offering an easy-to-manage, cost-efficient solution. Like Prometheus for metrics and Loki for logs, Tempo’s purpose is to aggregate, store, and query traces without the overhead of indexing. It’s ideal for teams who need tracing capabilities without the complexity and cost of traditional solutions.
Tempo stores data in object storage, such as Amazon S3, and doesn’t require indexing full trace contents, which means lower resource requirements and lower costs. It’s designed to work well alongside Grafana, Mimir, Prometheus, and Loki, unifying the observability pillars of metrics, logs, traces, and profiles.
Tempo Architecture#
The Tempo stack consists of essential components:
- Distributor: Validates and forwards incoming traces.
- Ingester: Buffers traces and writes them to object storage in chunks.
- Querier: Queries stored traces, handling request routing and data retrieval.
- Query Frontend: Optimizes query processing, including batching and caching.
- Compactor: Merges smaller chunks of trace data to optimize storage and performance.
Tempo’s architecture is designed to be lightweight and efficient, reducing the need for extensive resources and indexing. It can be deployed in a single-binary mode for simpler setups or as microservices to support higher scalability.
Why Tracing is Essential for Observability#
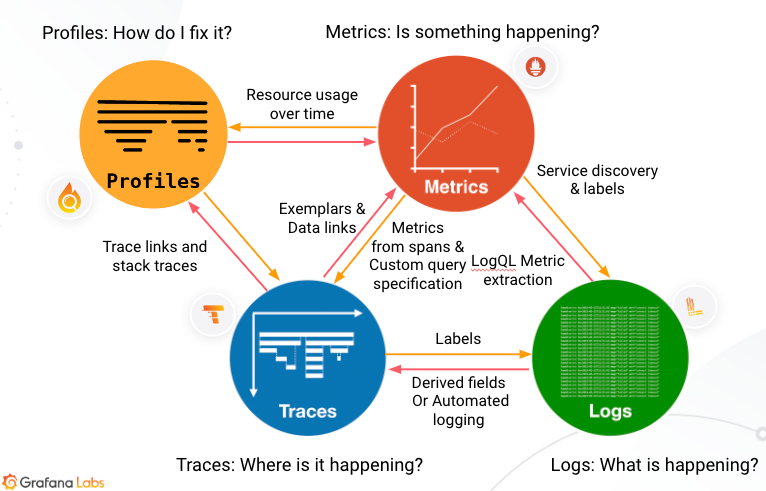
Metrics and logs are critical, but they can only tell you part of the story. Tracing adds context, showing you where issues occur across service requests and why they happen. With Tempo, you can:
- Diagnose Bottlenecks: Understand the request journey and identify services or operations that slow down your application.
- Reduce MTTR/MTTI: Isolate and resolve issues faster by tracing each step of a request through different services.
- Understand Dependencies: Reveal upstream and downstream relationships between services, helping you gauge the ripple effects of issues.
Tempo in Action: Distributed Tracing with Grafana Tempo#
Tempo enables organizations to track requests as they traverse distributed systems, making it possible to visualize and diagnose latency issues. Here’s how Tempo integrates into your stack:
- Exemplars and Span Metrics: With Tempo, you can create RED metrics (Request rate, Error rate, Duration) directly from traces, giving you actionable insights.
- Direct Trace Access: From a high-level metric, exemplars let you dive into a specific trace to understand what caused a performance change, enabling deep diagnostics.
- Integration with LogQL and TraceQL: Tempo’s TraceQL allows you to search trace data using a flexible, span-focused query language, bringing powerful trace-based filtering to the stack.
Deploying Tempo: Demo Walkthrough#
For this post, I’ve prepared a demo environment showcasing how to set up Tempo with a local Kubernetes cluster using Kind. This environment integrates Tempo with Grafana, Prometheus, and Loki for full-stack observability. Below is the structure of the setup:
.
├── Taskfile.yaml
├── app
│   ├── Dockerfile
│   ├── Taskfile.yaml
│   ├── go.mod
│   ├── go.sum
│   ├── log-generator.yaml
│   └── main.go
├── grafana-agent
│   └── values.yaml
├── ingress
│   └── grafana-local.yaml
├── kind-config.yaml
├── promtail
│   ├── promtail-encoded.yaml
│   ├── promtail-srekubecraftio.yaml
│   └── promtail.yaml
├── smoke_test
│   └── smoke_test.js
└── tempo
    └── values.yaml
You can access the full setup and configurations in the GitHub repository here.
With this setup, you can quickly get Grafana Tempo up and running, enabling distributed tracing and seamlessly integrating with the rest of your Grafana observability stack.
Practical Applications of Tempo#
- Enhanced MTTR and RCA: By visualizing the flow of requests, Tempo enables faster Mean Time To Repair (MTTR) and comprehensive root cause analysis.
- Tracing for Compliance: Tempo can confirm that service isolation policies are followed, aiding in policy adherence and compliance tracking.
- Exemplars and SLO Compliance: With exemplars, you can visualize latency variations and set alerts against Service Level Objectives (SLOs) based on trace data.
- TraceQL Queries: With TraceQL, you can filter spans by attributes, duration, or relationships, making debugging more precise and insightful.
{resource.service.name="srekubecraftio-service" && name="createLogEntry-1" && traceDuration>=300ms}
This query searches for spans within the srekubecraftio-service where the specific span name is createLogEntry-1 and the trace duration is greater than or equal to 300 milliseconds. Such a query helps in identifying performance bottlenecks for specific operations within your service.
Conclusion#
Grafana Tempo delivers powerful tracing capabilities without the cost or complexity of traditional systems. Its architecture, optimized for object storage and multi-cloud environments, makes Tempo a versatile choice for distributed tracing in modern observability stacks. Paired with Grafana, Mimir, Prometheus, and Loki, Tempo provides a full-spectrum observability solution for understanding and optimizing your system’s performance.
With Tempo, you can now correlate metrics, logs, and traces seamlessly, ensuring you have the insights needed to maintain and improve application reliability.