Cilium Tetragon - Next-Generation Runtime Security for Kubernetes
// Explore Cilium Tetragon, an eBPF-based security observability and runtime enforcement platform that provides kernel-level protection for Kubernetes workloads with minimal overhead.
In the ever-evolving landscape of Kubernetes security, runtime protection has become a critical concern for SREs and platform engineers. While we’ve made great strides with admission controllers, network policies, and vulnerability scanning, there’s always been a gap in real-time threat detection and prevention at the kernel level. Enter Cilium Tetragon, a powerful eBPF-based security observability and runtime enforcement platform that’s revolutionizing how we approach Kubernetes security.
What is Cilium Tetragon?#
Cilium Tetragon is an open-source, eBPF-based security observability and runtime enforcement platform that provides deep visibility into system behavior with minimal overhead. As part of the Cilium project (now a CNCF graduated project), Tetragon leverages eBPF technology to hook into the Linux kernel and monitor system calls, network events, and file operations in real-time.
Unlike traditional security tools that operate at the application layer, Tetragon works at the kernel level, giving it unprecedented visibility into what’s actually happening in your containers and nodes. It can detect and prevent security threats as they occur, not just after the fact.
Key Features of Tetragon#
1. Real-Time Security Observability#
Tetragon provides deep visibility into process execution, file access, network connections, and system calls. It can track the entire lifecycle of processes, including their ancestry, giving you a complete picture of what’s happening in your cluster.
2. Policy-Based Enforcement#
Using TracingPolicy CRDs, you can define exactly what behaviors to monitor and what actions to take when suspicious activity is detected. Policies can be as granular as monitoring specific system calls or as broad as tracking all network connections.
3. Kernel-Level Protection#
By operating at the kernel level with eBPF, Tetragon can detect and prevent threats that application-level security tools might miss, including kernel exploits, privilege escalations, and container escapes.
4. Low Overhead#
Thanks to eBPF’s efficiency, Tetragon adds minimal performance overhead (typically less than 1%) while providing comprehensive security monitoring.
5. Integration with Security Ecosystem#
Tetragon can export events in JSON format, making it easy to integrate with SIEM systems, observability platforms, or custom security workflows. It also integrates seamlessly with other Cilium components.
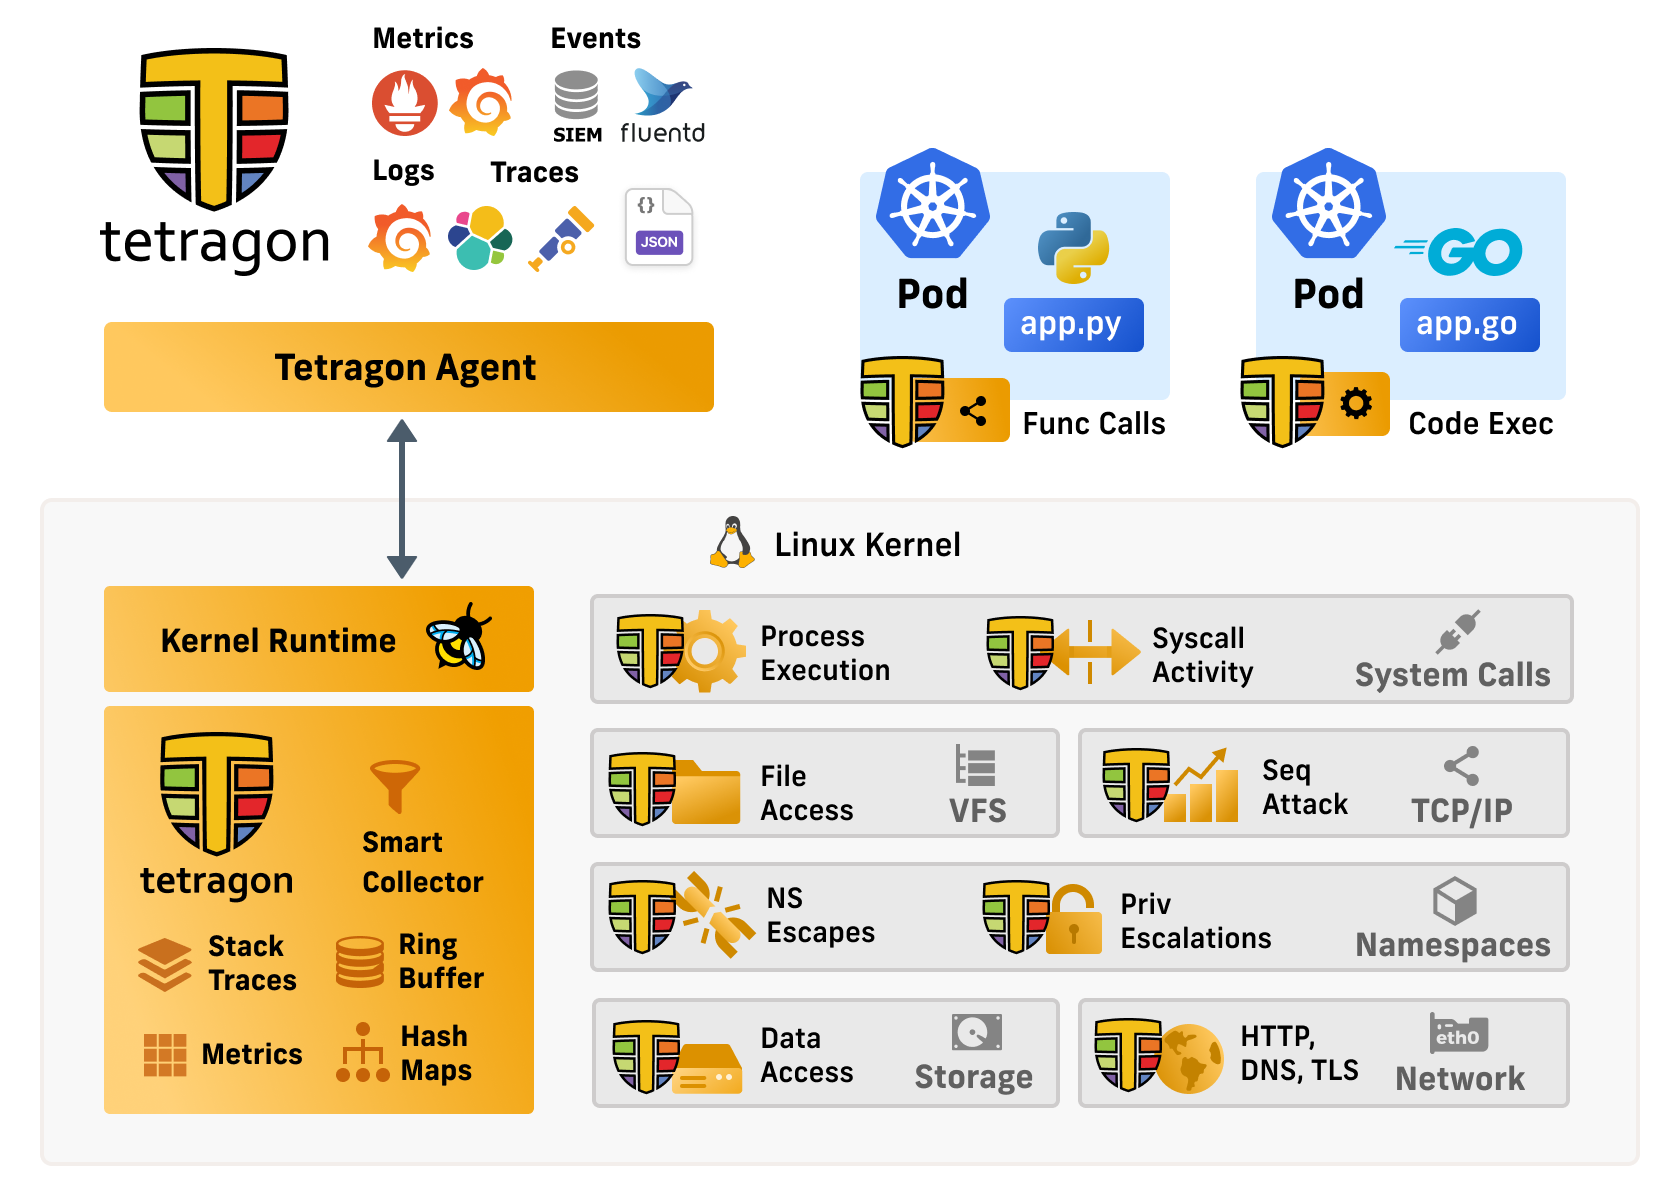
How Tetragon Works#
Tetragon uses eBPF programs that are dynamically loaded into the Linux kernel to monitor various system events. These programs can:
- Hook into system calls to monitor process execution, file operations, and network activity
- Track process relationships to understand the full context of security events
- Enforce policies by blocking suspicious activities in real-time
- Stream events to user space for analysis and alerting
The architecture consists of:
- eBPF programs: Running in kernel space for efficient event collection
- Tetragon agent: Running as a DaemonSet on each node
- gRPC API: For streaming events to external consumers
- CLI tools: For interactive debugging and monitoring
Pros and Cons of Using Tetragon#
| Pros | Cons |
|---|---|
| Unparalleled Visibility Kernel-level visibility into every system call, file access, and network connection in real-time | Linux Kernel Requirements Requires modern Linux kernel (5.4+) with eBPF support |
| Zero-Day Protection Behavioral monitoring detects novel threats that signature-based tools miss | Learning Curve Requires understanding of Linux system calls, eBPF, and security principles |
| Minimal Performance Impact Less than 1% overhead thanks to eBPF efficiency | Limited Windows Support Linux-specific tool, no support for Windows containers |
| Cloud-Native Design Kubernetes-native with CRD-based policies fitting GitOps workflows | Resource Consumption Still requires CPU and memory on each node |
| Flexible Policy Engine Granular policies from specific binaries to system calls with arguments | Event Volume Can generate massive event volumes requiring proper filtering |
| Real-Time Enforcement Can actively prevent threats by terminating processes or blocking calls | Policy Complexity Effective policies require deep application behavior knowledge |
| No Kernel Modules Uses safe eBPF technology without kernel modifications | Debugging Challenges Troubleshooting eBPF programs can be complex |
| Rich Context Tracks full process ancestry and relationships | Limited Ecosystem Fewer pre-built policies compared to mature tools |
Use Cases for Tetragon#
1. Container Escape Detection#
Monitor for suspicious system calls that might indicate container escape attempts, such as mounting filesystems or manipulating namespaces.
2. Cryptomining Detection#
Detect unauthorized cryptomining by monitoring for specific process patterns and network connections to known mining pools.
3. Supply Chain Attack Prevention#
Track process execution chains to detect when legitimate tools spawn unexpected child processes, a common pattern in supply chain attacks.
4. Compliance Monitoring#
Ensure compliance by monitoring and blocking access to sensitive files or preventing execution of unauthorized binaries.
5. Forensics and Incident Response#
Use Tetragon’s detailed event logs for post-incident analysis to understand exactly what happened during a security breach.
Tetragon vs Traditional Security Tools#
| Feature | Tetragon | Traditional Security Tools |
|---|---|---|
| Detection Method | Behavioral analysis via eBPF | Signature-based scanning |
| Performance Impact | < 1% overhead | Variable, often significant |
| Real-time Prevention | Yes, can block system calls | Usually detect-only |
| Kernel Visibility | Complete kernel-level view | Limited to application layer |
| Zero-Day Protection | Yes, behavior-based | Limited, relies on signatures |
| Integration Effort | Kubernetes-native | Often requires adaptation |
| Resource Requirements | Moderate | Often heavyweight |
Best Practices for Tetragon Deployment#
1. Start with Detection-Only#
Begin by deploying Tetragon in detection mode to understand your applications’ normal behavior before enabling enforcement.
2. Use Namespace Selectors#
Apply policies selectively using namespace selectors to avoid impacting system components.
3. Monitor Event Volume#
Implement proper event filtering and sampling to manage the volume of security events.
4. Gradual Policy Rollout#
Start with broad policies and gradually make them more specific as you understand your security requirements.
5. Integration with SIEM#
Export Tetragon events to your SIEM or observability platform for correlation with other security signals.
Practical Examples: Tetragon Security Policies in Action#
Let’s explore some real-world examples of how Tetragon can protect your Kubernetes workloads. These examples demonstrate various security scenarios from basic monitoring to advanced threat prevention.
Example 1: Detecting and Preventing Sensitive File Access#
This policy monitors and can block access to sensitive files like /etc/shadow or SSH keys:
apiVersion: cilium.io/v1alpha1
kind: TracingPolicy
metadata:
  name: "sensitive-file-access"
spec:
  kprobes:
    - call: "sys_openat"
      syscall: true
      args:
        - index: 0
          type: "int"
        - index: 1
          type: "string"
        - index: 2
          type: "int"
      selectors:
        - matchArgs:
            - index: 1
              operator: "Equal"
              values:
                - "/etc/shadow"
                - "/etc/passwd"
                - "/root/.ssh/id_rsa"
                - "/home/*/.ssh/id_rsa"
          matchActions:
            - action: Sigkill
              message: "Sensitive file access blocked"
Example 2: Container Escape Detection#
Monitor for potential container escape attempts by tracking suspicious system calls:
apiVersion: cilium.io/v1alpha1
kind: TracingPolicy
metadata:
  name: "container-escape-detection"
spec:
  kprobes:
    - call: "sys_mount"
      syscall: true
      args:
        - index: 0
          type: "string"
        - index: 1
          type: "string"
        - index: 2
          type: "string"
      selectors:
        - matchNamespaces:
            - namespace: "production"
              operator: In
          matchArgs:
            - index: 2
              operator: "Equal"
              values:
                - "proc"
                - "sysfs"
          matchActions:
            - action: Sigkill
              message: "Container escape attempt detected"
Example 3: Cryptocurrency Mining Detection#
Detect and prevent cryptocurrency mining by monitoring for known miner binaries and network connections:
apiVersion: cilium.io/v1alpha1
kind: TracingPolicy
metadata:
  name: "crypto-mining-detection"
spec:
  kprobes:
    - call: "sys_execve"
      syscall: true
      args:
        - index: 0
          type: "string"
      selectors:
        - matchArgs:
            - index: 0
              operator: "In"
              values:
                - "*/xmrig"
                - "*/minerd"
                - "*/ethminer"
                - "*/cgminer"
                - "*/bfgminer"
          matchActions:
            - action: Sigkill
              message: "Cryptocurrency miner detected and terminated"
    - call: "tcp_connect"
      syscall: false
      args:
        - index: 0
          type: "sock"
      selectors:
        - matchArgs:
            - index: 0
              operator: "DPort"
              values:
                - "3333"
                - "8333"
                - "9999"
          matchActions:
            - action: Sigkill
              message: "Mining pool connection blocked"
Example 4: Reverse Shell Detection#
Detect potential reverse shell connections by monitoring specific patterns:
apiVersion: cilium.io/v1alpha1
kind: TracingPolicy
metadata:
  name: "reverse-shell-detection"
spec:
  kprobes:
    - call: "sys_connect"
      syscall: true
      args:
        - index: 0
          type: "int"
        - index: 1
          type: "sockaddr"
      selectors:
        - matchBinaries:
            - operator: "In"
              values:
                - "/bin/bash"
                - "/bin/sh"
                - "/bin/dash"
                - "/bin/zsh"
                - "/usr/bin/nc"
                - "/usr/bin/netcat"
                - "/usr/bin/ncat"
          matchActions:
            - action: Sigkill
              message: "Potential reverse shell detected"
Example 5: Binary Execution Whitelist#
Allow only specific binaries to execute in production namespaces:
apiVersion: cilium.io/v1alpha1
kind: TracingPolicy
metadata:
  name: "binary-whitelist"
spec:
  kprobes:
    - call: "sys_execve"
      syscall: true
      args:
        - index: 0
          type: "string"
      selectors:
        - matchNamespaces:
            - namespace: "production"
              operator: In
          matchArgs:
            - index: 0
              operator: "NotIn"
              values:
                - "/usr/bin/node"
                - "/usr/bin/python3"
                - "/usr/bin/java"
                - "/app/*"
          matchActions:
            - action: Sigkill
              message: "Unauthorized binary execution blocked"
Example 6: Privilege Escalation Detection#
Monitor for potential privilege escalation attempts:
apiVersion: cilium.io/v1alpha1
kind: TracingPolicy
metadata:
  name: "privilege-escalation-detection"
spec:
  kprobes:
    - call: "sys_setuid"
      syscall: true
      args:
        - index: 0
          type: "int"
      selectors:
        - matchArgs:
            - index: 0
              operator: "Equal"
              values:
                - "0"
          matchActions:
            - action: Sigkill
              message: "Privilege escalation to root blocked"
    - call: "sys_setgid"
      syscall: true
      args:
        - index: 0
          type: "int"
      selectors:
        - matchArgs:
            - index: 0
              operator: "Equal"
              values:
                - "0"
          matchActions:
            - action: Sigkill
              message: "Privilege escalation to root group blocked"
Example 7: Data Exfiltration Prevention#
Monitor and prevent potential data exfiltration via common tools:
apiVersion: cilium.io/v1alpha1
kind: TracingPolicy
metadata:
  name: "data-exfiltration-prevention"
spec:
  kprobes:
    - call: "sys_execve"
      syscall: true
      args:
        - index: 0
          type: "string"
      selectors:
        - matchBinaries:
            - operator: "In"
              values:
                - "/usr/bin/curl"
                - "/usr/bin/wget"
                - "/usr/bin/scp"
                - "/usr/bin/rsync"
                - "/usr/bin/sftp"
          matchNamespaces:
            - namespace: "production"
              operator: In
          matchActions:
            - action: Sigkill
              message: "Data exfiltration tool blocked"
Example 8: Process Monitoring with Tetragon CLI#
Here are some useful Tetragon CLI commands for real-time monitoring:
# Stream all process execution events
kubectl exec -n kube-system ds/tetragon -c tetragon -- tetra getevents -o compact --pods --namespace default

# Monitor file access events
kubectl exec -n kube-system ds/tetragon -c tetragon -- tetra getevents -o compact --process --file-access

# Watch for network connections
kubectl exec -n kube-system ds/tetragon -c tetragon -- tetra getevents -o compact --process --network

# Export events in JSON format for SIEM integration
kubectl exec -n kube-system ds/tetragon -c tetragon -- tetra getevents -o json > tetragon-events.json

# Get events for a specific pod
kubectl exec -n kube-system ds/tetragon -c tetragon -- tetra getevents --pods --namespace production --pod-regex "frontend-.*"

# Monitor with filters
kubectl exec -n kube-system ds/tetragon -c tetragon -- tetra getevents --process --filter-binary=/usr/bin/curl
Example 9: Observability Integration#
Export Tetragon events to your observability stack:
apiVersion: v1
kind: ConfigMap
metadata:
  name: tetragon-config
  namespace: kube-system
data:
  export-stdout: |
    {"level":"info","report":"stdout"}
  export-filename: |
    {"filename":"/var/log/tetragon/tetragon.log"}
  export-rate-limit: |
    {"events_per_second":1000}
---
apiVersion: cilium.io/v1alpha1
kind: TracingPolicy
metadata:
  name: "observability-export"
spec:
  options:
    - name: "export-rate-limit"
      value: "5000"
    - name: "export-file-max-size-mb"
      value: "100"
    - name: "export-file-rotation"
      value: "10"
Example 10: Testing Tetragon Policies#
Create a test pod to validate your security policies:
apiVersion: v1
kind: Pod
metadata:
  name: tetragon-test-pod
  namespace: default
spec:
  containers:
    - name: test
      image: ubuntu:latest
      command: ["/bin/sleep", "3600"]
      securityContext:
        capabilities:
          add:
            - SYS_PTRACE
---
apiVersion: v1
kind: ConfigMap
metadata:
  name: tetragon-test-script
  namespace: default
data:
  test.sh: |
    #!/bin/bash
    echo "Testing Tetragon policies..."

    # Test 1: Try to read sensitive file (should be blocked)
    echo "Test 1: Reading /etc/shadow"
    cat /etc/shadow 2>&1 || echo "Blocked as expected"

    # Test 2: Try to execute curl (should be blocked in production)
    echo "Test 2: Running curl"
    curl http://example.com 2>&1 || echo "Blocked as expected"

    # Test 3: Try to change UID to root (should be blocked)
    echo "Test 3: Attempting privilege escalation"
    python3 -c "import os; os.setuid(0)" 2>&1 || echo "Blocked as expected"

    echo "All tests completed!"
Tips for Writing Effective Tetragon Policies#
- Start Simple: Begin with basic policies and gradually add complexity
- Use Namespaces: Scope policies to specific namespaces to avoid affecting system components
- Test Thoroughly: Always test policies in development environments first
- Monitor Performance: Use metrics to ensure policies aren’t causing performance issues
- Document Policies: Maintain clear documentation about what each policy does and why
- Regular Reviews: Periodically review and update policies based on new threats
- Combine with Other Tools: Use Tetragon alongside other security tools for defense in depth
Conclusion#
Cilium Tetragon represents a paradigm shift in Kubernetes runtime security. By leveraging eBPF technology, it provides unprecedented visibility into system behavior while maintaining minimal overhead. For SREs and security teams looking to enhance their Kubernetes security posture, Tetragon offers a powerful solution that can detect and prevent threats that traditional tools might miss.
While there’s a learning curve and some infrastructure requirements to consider, the benefits of kernel-level security observability and real-time enforcement make Tetragon a compelling addition to any Kubernetes security stack. As threats become more sophisticated, tools like Tetragon that can see and stop attacks at the kernel level will become increasingly essential.
In the next section, we’ll walk through a practical demonstration of deploying Tetragon on an AKS cluster and creating custom security policies to protect your workloads.
Demo: Hands-on with Tetragon on AKS#
To help you get started with Cilium Tetragon, I’ve created a demo that shows how to deploy and configure Tetragon on Azure Kubernetes Service (AKS). The demo includes:
- AKS cluster setup with optimal configuration for Tetragon
- Step-by-step Tetragon installation using Helm
- Real-world security policies ready to deploy
- Attack simulation scenarios to test detection capabilities
- Monitoring and observability setup for security events
GitHub Repository 🔗 Tetragon Demo Repository
Check out the repository for detailed instructions, example policies, and scripts to help you implement Tetragon in your own AKS environment. The demo covers everything from basic process monitoring to advanced threat detection scenarios.